Rainbow Paper Presentation Template Column Chart1 – Visualizing Market Trends
RJ0200024_10
- Last Update 04/03/2025
- File Size 2.5MB
- # of Slides 2
- File Format PPTX
- Slide Ratio 16:9
- Color
Keywords
- #Content-Based Slides
- #Design-Based Slides
- #Business Strategy
- #Market and Competitor Analysis
- #Graph
- #Achievements
- #Market Status
- #Column
- #Column Chart
- #16:9
- #vertical column chart PowerPoint
- #column chart slide template
- #year-over-year comparison graph
- #business performance visualization
- #data chart PowerPoint slide
About the Product
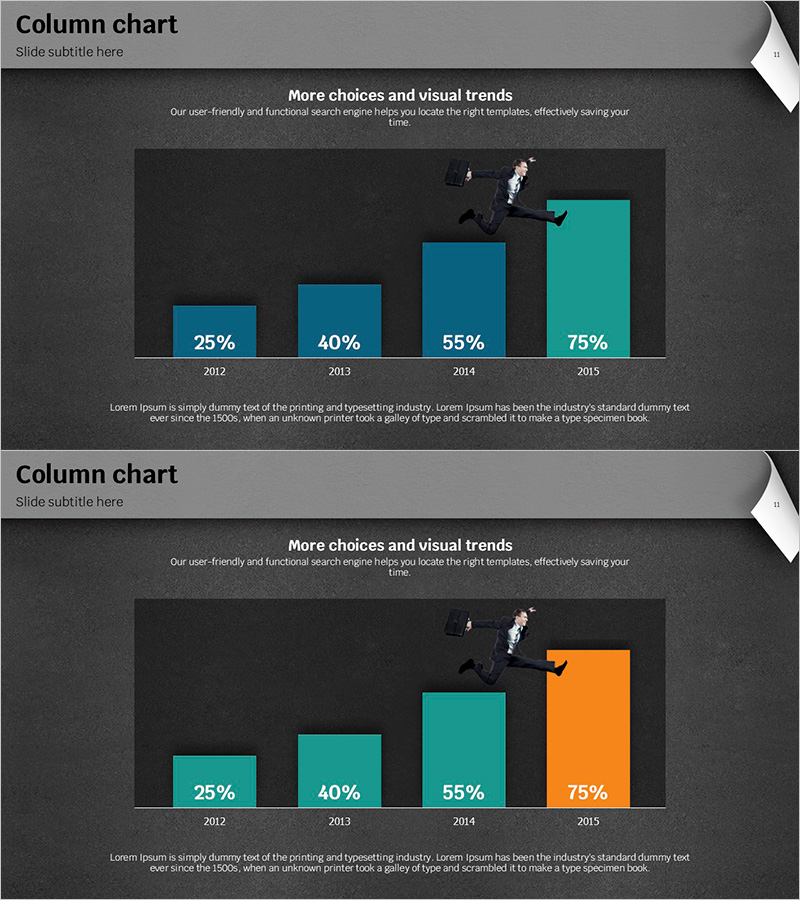
A vertical column chart PowerPoint slide set featuring 2 slides designed to visualize year-over-year performance metrics. The chart displays data from 2012 to 2015 with values of 25%, 40%, 55%, and 75%, using a teal-to-orange dual-color scheme to clearly distinguish growth trends. Set against a dark background with white text and numeric labels, the slides offer excellent readability for presentations. Ideal for business performance reports, market analysis, sales trends, and quarterly reviews that require clear quantitative data visualization.
Usage Points
-
Main Usage
Designed to compare numerical data across multiple time periods or categories using bar height as the primary visual element. Effectively communicates business performance, revenue figures, market share, customer satisfaction scores, and other quantitative metrics with immediate visual impact.
-
How to Use
The 2-slide set features identical chart structures with different color treatments—the first emphasizes teal gradients while the second highlights orange accents, allowing you to present the same data from different analytical perspectives. Simply edit the numeric values and year labels to match your dataset, and all elements remain fully editable in PPTX format.
-
Recommended For
Suitable for business plans, quarterly performance reports, marketing campaign results, investor presentations, and executive briefings. Finance teams, marketing departments, sales professionals, and business analysts can use these slides to present quantitative achievements with credibility and clarity.
-
Slide Structure
Each slide contains a title section, subtitle text, a 4-bar vertical column chart (2012–2015), numeric labels (25%, 40%, 55%, 75%), and descriptive text at the bottom. Optimized for 16:9 widescreen format with fully editable elements in PPTX format.
Related Products
-

Market Analysis Vertical Bar Graph
#Business Strategy #Market and Competitor Analysis #Graph
-

Alphabet Study Bar Chart – Vibrant Design
#Business Strategy #Market and Competitor Analysis #Financial Plans and Performance
-

Sewing Graph Chart – Market Status and Performance Analysis
#Business Strategy #Market and Competitor Analysis #Diagram
-

Sports Vertical Bar Chart – The Perfect Choice for Performance Analysis
#Business Strategy #Market and Competitor Analysis #Graph
