Fantastic Wide PPT Flow Chart2 - Company Introduction and Development Status
RJ0200049_6
- Last Update 04/12/2025
- File Size 0.6MB
- # of Slides 2
- File Format PPTX
- Slide Ratio 16:9
- Color
Keywords
- #Content-Based Slides
- #Design-Based Slides
- #Company Introduction
- #Product/Service Introduction
- #Diagram
- #Business Areas
- #Development Status
- #Flow
- #Linear Flow
- #16:9
- #linear flow diagram PowerPoint
- #3-step process slide template
- #timeline diagram presentation
- #company introduction flowchart
- #development status PPT template
About the Product
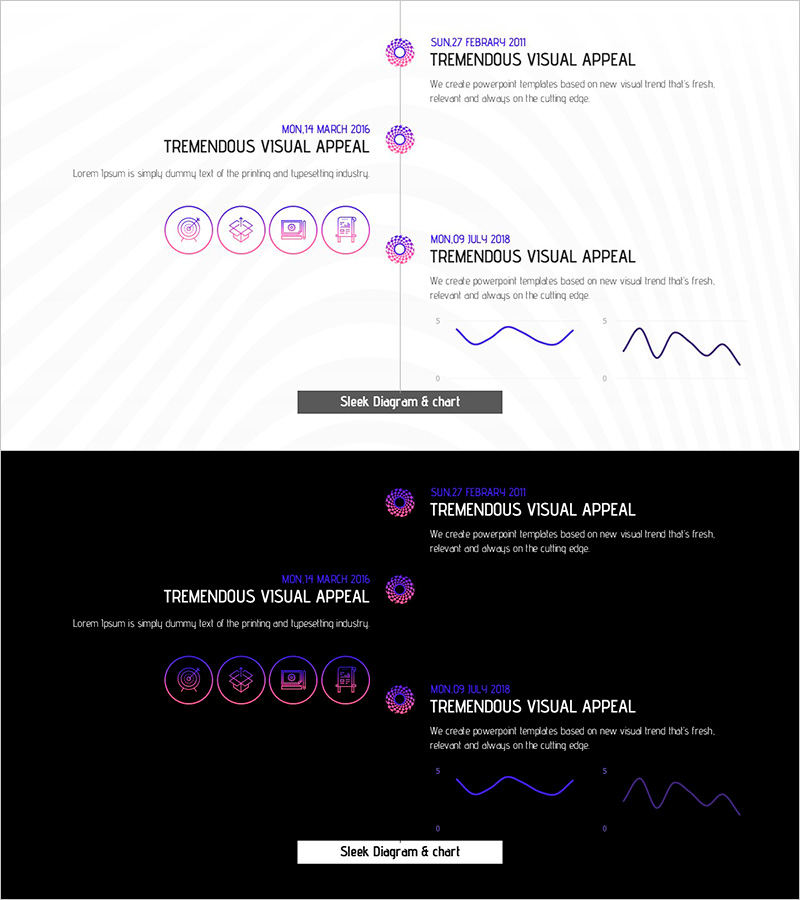
A linear flow diagram PowerPoint slide designed to present company introduction and development status through sequential stages. The slide features three pink-toned circular nodes connected by lines, clearly representing a 3-step process with dedicated spaces for icons and text in each stage. Formatted in 16:9 widescreen ratio with 2 slides total, it includes both a timeline-style flowchart and curved trend graphs. This presentation template is ready to use for corporate strategy presentations, product development roadmaps, business implementation phases, and other professional slide decks.
Usage Points
-
Main Usage
Visualize corporate development progression, product development stages, and business implementation timelines in a linear flow format to enhance audience comprehension. Each stage is highlighted with icons and text to maximize information delivery efficiency.
-
How to Use
Ideal for company introduction presentations, new product launch roadmaps, business plan explanations, organizational restructuring processes, and project status reports. Customize each node's text and icons to create tailored presentation materials for your specific needs.
-
Recommended For
Suitable for executive briefings, investor presentations, employee onboarding sessions, marketing team meetings, and product development team presentations. Particularly effective when emphasizing time-based progression or step-by-step processes.
-
Slide Structure
Slide 1: Three circular nodes arranged left-to-right in linear sequence with connecting lines, four icons per node and text input areas. Slide 2: Timeline format with date markers and curved/line graphs displaying trend changes and progression data.
Related Products
-

Business Forest Wide Template Diagram7 – A Visual Tool for Success
#Company Introduction #Product/Service Introduction #Graph
-

Joint Business Development Status - Visualized Data with Cluster
#Company Introduction #Product/Service Introduction #Diagram
-

Chemical Experiment Research Analysis Diagram – Innovation and Progress
#Company Introduction #Product/Service Introduction #Diagram
-

Touch Wide Slide Template - Modern Mockup Design
#Product/Service Introduction #Technical Approach #Diagram
