Joint Business Development Status - Visualized Data with Cluster
RJ0300078_24
- Last Update 05/10/2025
- File Size 1.4MB
- # of Slides 2
- File Format PPTX
- Slide Ratio 16:9
- Color
Keywords
- #Content-Based Slides
- #Design-Based Slides
- #Company Introduction
- #Product/Service Introduction
- #Diagram
- #Business Areas
- #Development Status
- #Cluster
- #Closed Cluster Diagram
- #16:9
- #cluster diagram PowerPoint
- #data visualization slide template
- #5-item percentage chart
- #icon infographic PPT
- #business status presentation slide
About the Product
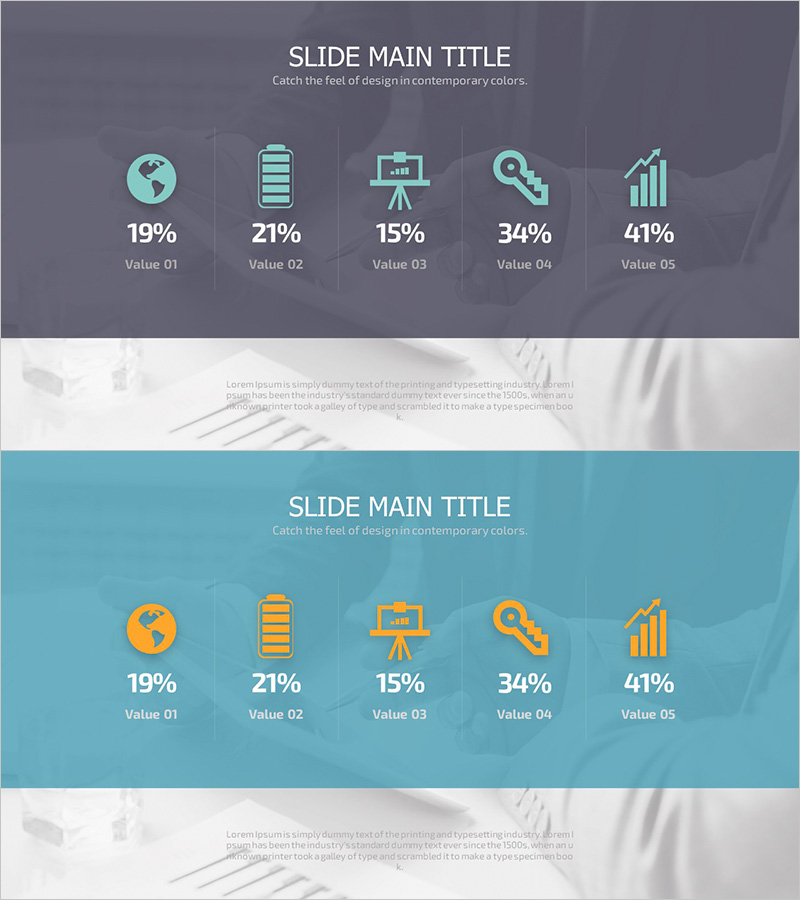
A cluster-style PowerPoint slide visualizing joint business development status with 5 icons and percentage values. The design features a gray background with teal-colored icons arranged horizontally, each paired with percentage data (19%-41%) and Value labels for clear information hierarchy. Two-slide deck presents both gray and teal background variations, enabling consistent tone-and-manner application across presentations. Ideal for business status reports, performance analysis, and data-driven decision-making materials. Fully editable and ready for immediate use.
Usage Points
-
Main Usage
Visualize and compare five key business metrics—such as joint development progress, departmental performance, project completion rates, or market share—in a single, easy-to-scan layout. Each icon represents a distinct business area, while percentage values clearly indicate relative importance and contribution.
-
How to Use
Deploy in executive briefings, quarterly performance reviews, business status analyses, and investor presentations to highlight core metrics. Replace icons and percentages with your own data; adjust background and icon colors to match corporate branding. The two-tone color scheme provides flexibility for different presentation contexts.
-
Recommended For
Executives, business development teams, marketing professionals, finance teams, and consultants requiring data-driven decision support. Particularly effective for multi-project status updates, multi-channel performance reporting, and portfolio composition analysis.
-
Slide Structure
Slide 1: Gray background with 5 horizontally arranged icons (globe, battery, presentation stand, magnifying glass, bar chart), each with percentage label (19%-41%) and Value indicator below. Slide 2: Identical layout on teal background for color variation. 16:9 widescreen format optimized for modern presentation environments.
Related Products
-

Cluster Diagram Slide for Construction Field Introduction
#Company Introduction #Business Introduction #Diagram
-

Social Contribution Diagram – Business Vision and Strategy
#Company Introduction #Business Vision and Strategy #Diagram
-

Product Line-up Introduction Slide – Style and Technology
#Product/Service Introduction #Diagram #Development Status
-

Strategic Element Relationship Map – Business Insights
#Company Introduction #Business Introduction #Diagram
