Visualizing Operational Strategies with Donut Charts – Achievements and Goals
RJ0200049_24
- Last Update 04/12/2025
- File Size 0.5MB
- # of Slides 2
- File Format PPTX
- Slide Ratio 16:9
- Color
Keywords
- #Content-Based Slides
- #Design-Based Slides
- #Operational Plan
- #Marketing Plan and Strategy
- #Graph
- #Production and Technology Development Strategy
- #Marketing Objectives
- #Circles
- #Doughnut Chart
- #16:9
- #donut chart PowerPoint slide
- #pie chart template
- #ratio visualization PPT
- #donut graph presentation
- #performance metrics slide
- #PowerPoint chart template
- #how to create donut chart in PowerPoint
About the Product
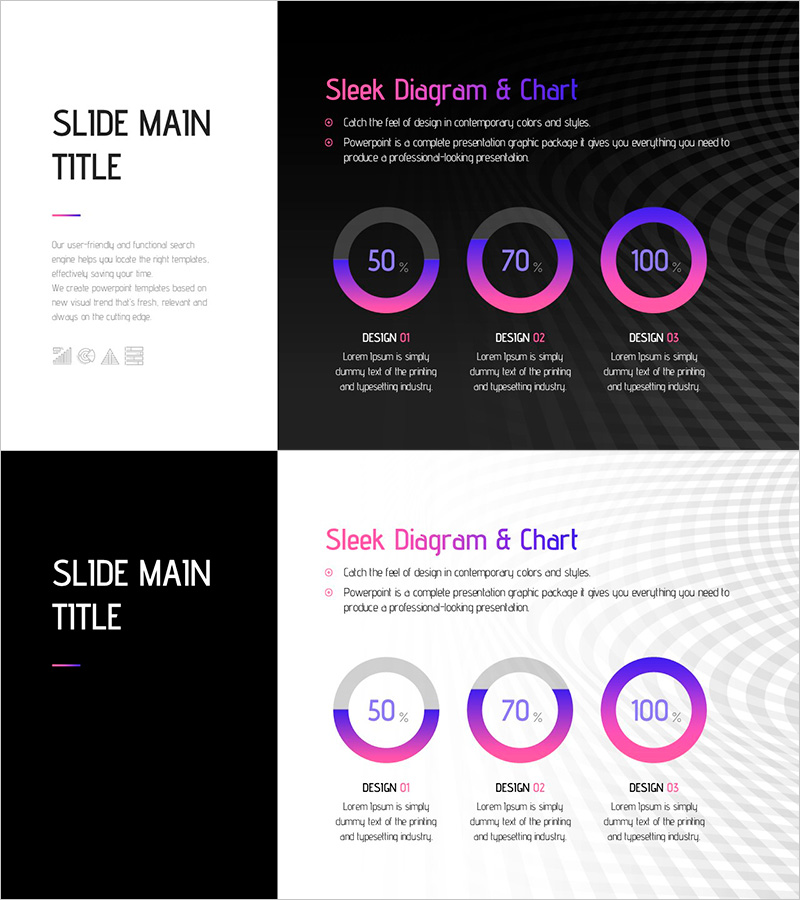
A PowerPoint slide featuring three donut-shaped pie charts for visualizing proportions across three categories. The charts use a gradient color scheme of purple, pink, and blue, with percentage values displayed in the center of each donut. This presentation template is ideal for operational strategy, marketing goals, and performance management presentations. The 16:9 widescreen format includes 2 slides, allowing you to adapt multiple data scenarios and comparisons effectively.
Usage Points
-
Main Usage
Visualize and compare proportions across multiple categories in operational strategy, marketing objectives, and performance management contexts. The percentage values displayed in the center of each donut chart clearly communicate quantitative data, while color differentiation makes it easy to distinguish between items.
-
How to Use
Use in executive briefings, management meetings, marketing presentations, and quarterly performance reviews to illustrate goal achievement rates, budget allocation, market share, or other ratio-based metrics. Simply edit the percentage values and labels with your own data to create a professional presentation immediately.
-
Recommended For
Ideal for executives, marketing managers, project managers, sales leaders, and finance professionals who need to communicate quantitative performance visually. Suitable for quarterly business reviews, strategic planning sessions, investor presentations, and cross-functional team meetings.
-
Slide Structure
2-slide set with 3 donut-shaped pie charts per slide. Each chart features a purple-to-pink-to-blue gradient design with percentage values (50%, 70%, 100%, etc.) centered within the donut. Label areas below each chart allow you to add item names and descriptions for customization.
Related Products
-

Spring Pastel Wide PowerPoint Template Mockup&Donut Chart
#Product/Service Introduction #Marketing Plan and Strategy #Graph
-

Magic Analysis Chart for Visualizing Operations and Marketing Goals
#Operational Plan #Marketing Plan and Strategy #Diagram
-

Paint Splash Bar Chart Template – Market Analysis and Strategy
#Market and Competitor Analysis #Marketing Plan and Strategy #Graph
-

Organization Headcount Doughnut Chart – Visualizing Operational Plans
#Operational Plan #Graph #Production and Technology Development Strategy
