Modern Blue Doughnut Chart – Visualizing Marketing Strategies
RJ0200035_27
- Last Update 04/07/2025
- File Size 1MB
- # of Slides 2
- File Format PPTX
- Slide Ratio 16:9
- Color
Keywords
- #Content-Based Slides
- #Design-Based Slides
- #Product/Service Introduction
- #Marketing Plan and Strategy
- #Graph
- #Development Status
- #Marketing Objectives
- #Circles
- #Doughnut Chart
- #16:9
- #doughnut chart PowerPoint
- #pie chart slide template
- #ratio visualization PPT
- #marketing data chart
- #two-series doughnut diagram
About the Product
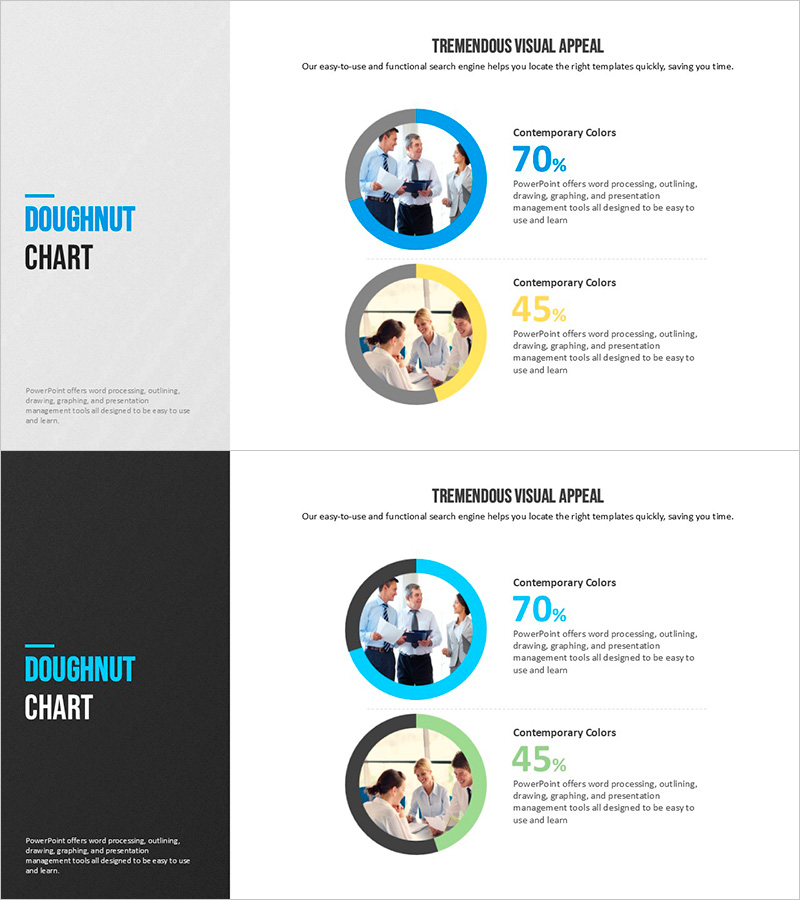
A 2-slide doughnut chart PowerPoint template optimized for marketing strategy presentations and product introductions. The contrasting blue and yellow color schemes enable simultaneous visualization of two key data ratios, with percentage values and descriptive text positioned beside each chart for clear information delivery. The circular chart design features a center image insertion area, allowing you to highlight product photos or team images for enhanced visual impact. Formatted in PPTX with 16:9 widescreen optimization for immediate editing and use in market analysis, customer satisfaction surveys, product preference comparisons, and various business presentations.
Usage Points
-
Main Usage
This slide is designed to compare two key metrics simultaneously—such as market share, customer preference, or product ratio—during marketing strategy presentations. The center image area of each doughnut chart allows insertion of product photos or team images, maximizing the visual impact of your data presentation.
-
How to Use
Click on each color segment of the doughnut chart to modify the percentage values. Enter the corresponding item name and description in the adjacent text boxes. Insert product or team photos into the circular image area at the center of each chart. Adjust colors to match your corporate brand identity as needed.
-
Recommended For
Marketing managers, product planners, sales directors, and executives presenting market analysis, customer satisfaction surveys, product competitiveness assessments, and sales performance comparisons. Particularly effective when emphasizing two primary metrics in business presentations.
-
Slide Structure
2-slide layout with one doughnut chart per slide, each featuring a center image insertion area. Left side displays 'Doughnut Chart' title, while the right side shows two color-coded segments (blue 70%, yellow 45%) with percentage values and descriptive text fields. Optimized for 16:9 widescreen display format.
Related Products
-

Spring Pastel Wide PowerPoint Template Mockup&Donut Chart
#Product/Service Introduction #Marketing Plan and Strategy #Graph
-

Big Data Technology Analysis Graph – Market Share Visualization
#Product/Service Introduction #Market and Competitor Analysis #Diagram
-

Internet of Things User Analysis Status – Customer Insights and Data Visualization
#Product/Service Introduction #Market and Competitor Analysis #Graph
-

VR System Development Status Analysis Graph – Visualization of Market Share
#Product/Service Introduction #Market and Competitor Analysis #Graph
