PPT Template Visualizing Operations with Doughnut Chart
RJ0200008_32
- Last Update 03/30/2025
- File Size 3.3MB
- # of Slides 2
- File Format PPTX
- Slide Ratio 16:9
- Color
Keywords
- #Content-Based Slides
- #Design-Based Slides
- #Operational Plan
- #Marketing Plan and Strategy
- #Graph
- #Capital Investment Plan
- #Marketing Objectives
- #Circles
- #Doughnut Chart
- #16:9
- #doughnut chart PowerPoint
- #donut graph slide template
- #pie chart visualization
- #ratio data PPT
- #operational plan presentation
- #marketing strategy chart
About the Product
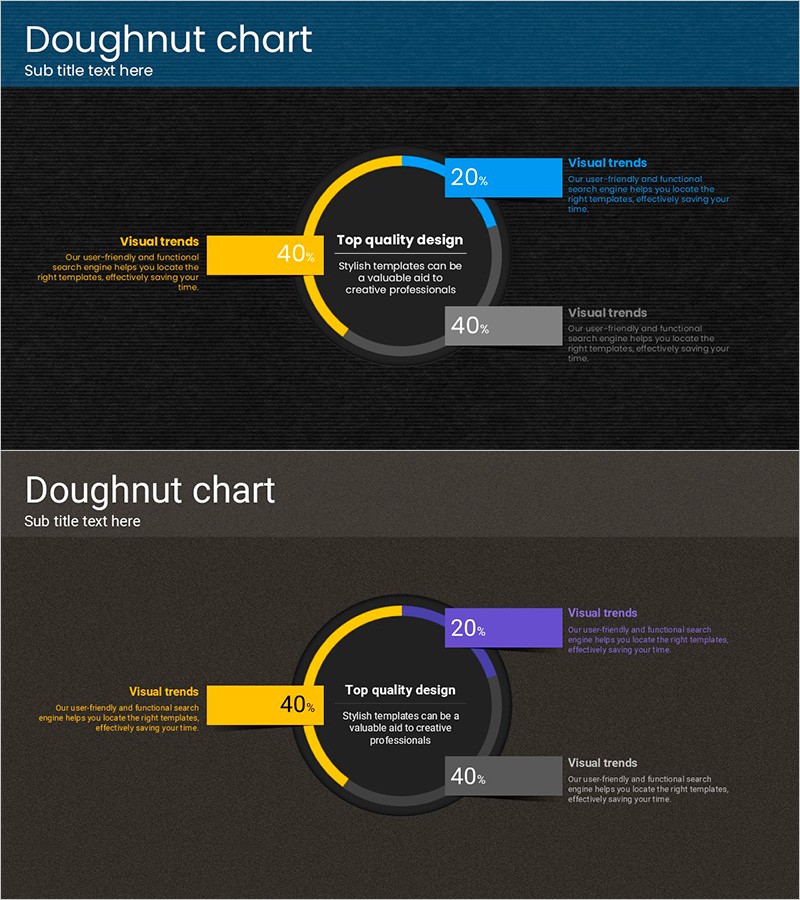
A doughnut chart PowerPoint slide designed to visualize operational plans and marketing strategies. This 2-slide presentation template features a dark background with yellow, blue, and gray color schemes to clearly represent ratio data. Each segment includes dedicated text areas for detailed explanations, allowing you to communicate key insights alongside the visual data. The doughnut structure's central space can accommodate additional information or core messages, making it immediately applicable for presentations, reports, and planning documents.
Usage Points
-
Main Usage
Use this template when comparing and analyzing three or more items as proportional ratios, such as operational plans, marketing strategies, or business performance metrics. The doughnut structure's central space emphasizes key figures or titles, enhancing visual impact. Text areas beside each chart support detailed data interpretation.
-
How to Use
Edit the percentage values and color segments to match your actual data. Adjust the doughnut chart segment sizes to reflect accurate proportions and modify the text descriptions accordingly. The dark background combined with bright accent colors ensures excellent visibility in projector presentations and digital displays.
-
Recommended For
Ideal for executive reports, quarterly performance presentations, marketing strategy meetings, and business planning sessions. Recommended for finance teams, marketing departments, and strategic planning units presenting data-driven insights. Also effective for consulting proposals and investor pitch decks.
-
Slide Structure
2-slide layout with 3-segment doughnut charts on each slide. First slide uses yellow, blue, and gray color palette; second slide features yellow, purple, and gray variations. Text explanation areas positioned beside each chart enable ratio interpretation and detailed content delivery simultaneously.
Related Products
-

Structure Presentation Template Doughnut Chart – Market Analysis and Marketing Strategy
#Market and Competitor Analysis #Marketing Plan and Strategy #Graph
-

Facility Capacity and Utilization Chart – Emphasizing Operational Efficiency
#Business Introduction #Operational Plan #Diagram
-

Spring Pastel Wide PowerPoint Template Mockup&Donut Chart
#Product/Service Introduction #Marketing Plan and Strategy #Graph
-

Paint Splash Bar Chart Template – Market Analysis and Strategy
#Market and Competitor Analysis #Marketing Plan and Strategy #Graph
