Modern Business Doughnut Chart Template – Visualizing Marketing Strategies
RJ0200028_13
- Last Update 04/05/2025
- File Size 4.1MB
- # of Slides 2
- File Format PPTX
- Slide Ratio 16:9
- Color
Keywords
- #Content-Based Slides
- #Design-Based Slides
- #Marketing Plan and Strategy
- #Graph
- #Other
- #Marketing Objectives
- #Marketing Strategy
- #Circles
- #Doughnut Chart
- #Silhouette
- #16:9
- #circular chart PowerPoint
- #doughnut chart slide template
- #ratio visualization presentation
- #marketing data chart
- #business metrics slide
- #pie chart PowerPoint template download
About the Product
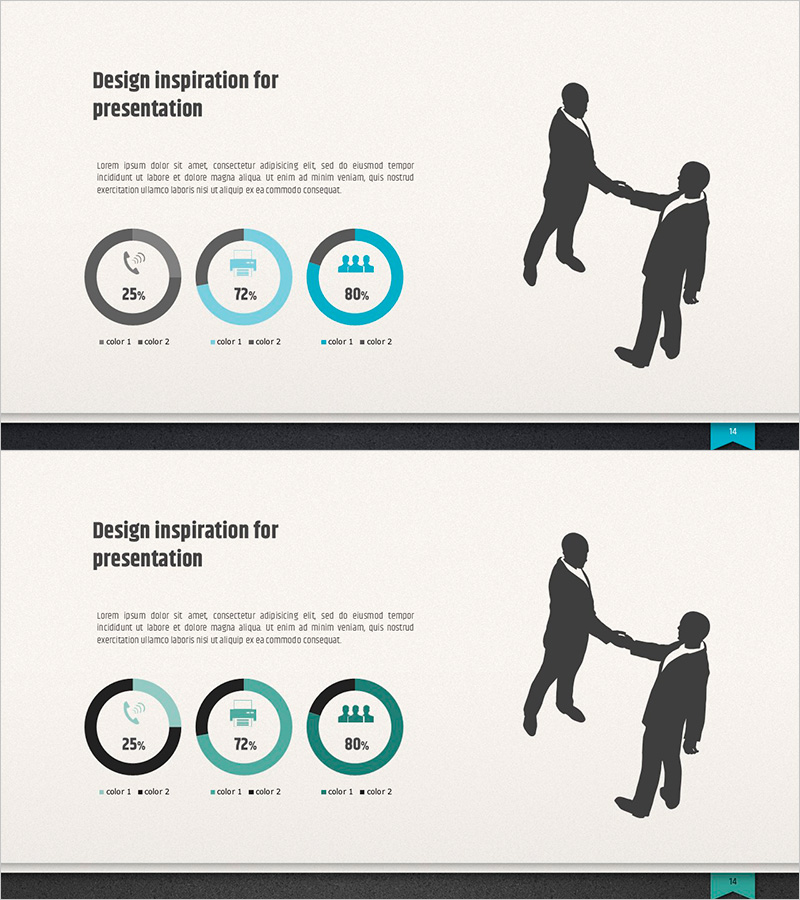
A professional PowerPoint slide deck featuring circular charts paired with business silhouettes to visualize marketing strategies and performance metrics. The design combines grayscale business figures with teal accent colors, displaying three pie/doughnut charts (25%, 72%, 80%) for clear data comparison. This 2-slide presentation template is ideal for showcasing marketing analytics, sales performance, customer satisfaction, and key business indicators. Fully editable and ready to integrate into reports and corporate presentations.
Usage Points
-
Main Usage
Present three key performance indicators, market share percentages, customer satisfaction ratings, or sales metrics using circular charts. The business silhouette imagery reinforces themes of teamwork, growth, and professional collaboration in your presentation.
-
How to Use
Replace the sample percentages (25%, 72%, 80%) with your actual data values. Customize chart labels, adjust colors to match your corporate branding, and modify the accompanying text. The silhouette elements can be repositioned or resized as needed for layout flexibility.
-
Recommended For
Marketing managers, sales directors, business analysts, executive presentations, quarterly performance reviews, client proposals, investor pitches, and strategic planning meetings where quantitative data visualization is essential.
-
Slide Structure
Two-slide layout with each slide containing three doughnut/pie charts arranged horizontally, accompanied by business silhouettes of two professionals in collaborative poses. Teal accent colors highlight the charts against a neutral gray background, with data labels and legends positioned below each chart.
Related Products
-

Structure Presentation Template Doughnut Chart – Market Analysis and Marketing Strategy
#Market and Competitor Analysis #Marketing Plan and Strategy #Graph
-

Business Strategy Silhouette Diagram – Visualizing Business Strategy
#Business Vision and Strategy #Marketing Plan and Strategy #Diagram
-

Visualize Business Execution Plan with Linear Flow Diagram – Customer Analysis and Strategy
#Market and Competitor Analysis #Marketing Plan and Strategy #Diagram
-

Simple & Modern Donut Chart PowerPoint – Essential for Business Strategy Development
#Business Strategy #Marketing Plan and Strategy #Graph
