Fantastic Wide PPT Vertical Bar Segmentation Chart – Visualization of Business Strategy
RJ0200049_19
- Last Update 04/12/2025
- File Size 0.5MB
- # of Slides 2
- File Format PPTX
- Slide Ratio 16:9
- Color
Keywords
- #Content-Based Slides
- #Design-Based Slides
- #Business Introduction
- #Business Strategy
- #Graph
- #Revenue Model
- #Column
- #Segmented Column
- #Project Progress
- #16:9
- #vertical bar chart PowerPoint
- #segmented bar graph presentation
- #business performance slide
- #year-over-year trend chart
- #stacked bar chart template
About the Product
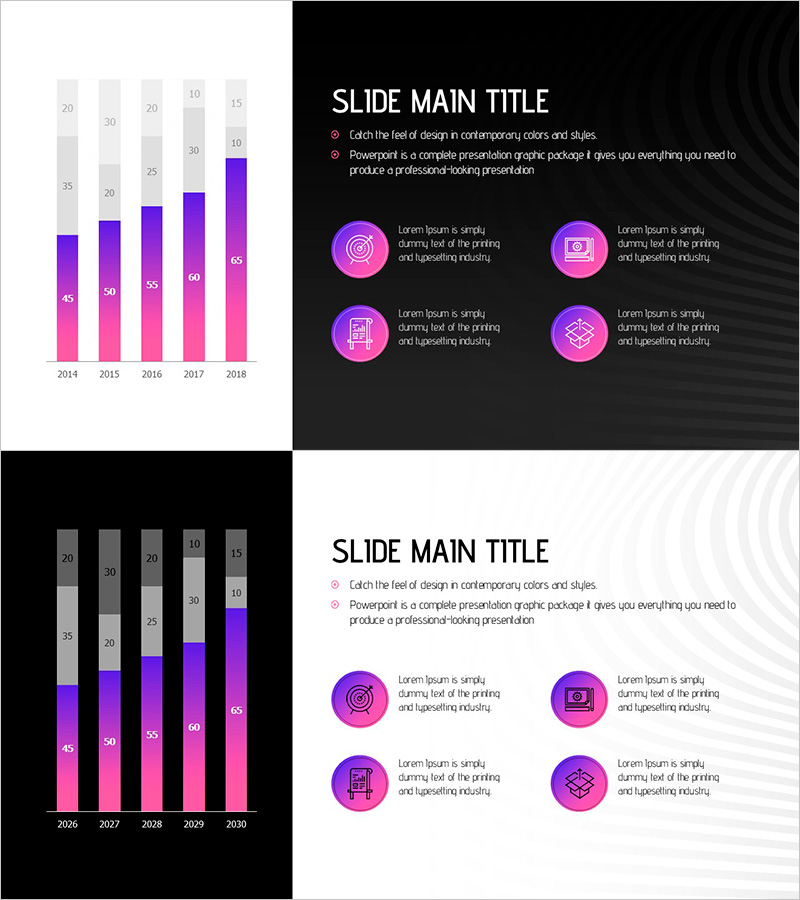
A vertical bar segmentation chart PowerPoint slide that visualizes business progress and performance over a 5-year period. The data is represented with a purple-to-pink gradient, making year-over-year trends immediately clear. Each year displays numerical labels at the top for precise value comparison, and two layout options are provided: dark background and light background. This presentation slide effectively communicates business metrics such as revenue trends, customer growth, and performance milestones across multiple years.
Usage Points
-
Main Usage
Compares time-series data such as annual business performance, revenue trends, and customer growth using stacked bar format. Simultaneously displays overall scale and internal composition breakdown, allowing audiences to understand both total growth and component contributions at a glance.
-
How to Use
Use in business plans, management reports, and investor presentations to explain historical performance and growth trajectory. Dark background slides suit premium presentation settings, while light background slides work well for formal report documents. Data values are fully editable for inputting actual figures.
-
Recommended For
Executives, business managers, marketing teams, and financial analysts presenting quarterly or annual performance to senior leadership or investors. Particularly effective when emphasizing cumulative growth or expressing multiple departments' contributions simultaneously.
-
Slide Structure
2-slide set. Each slide displays a vertical bar segmentation chart covering 2014–2018 (5 years), with 2–3 color layers per year representing cumulative data. Numerical labels (45, 50, 55, 60, 65, etc.) appear above each bar for precise value reference.
Related Products
-

Geometry PPT Template Wide Vertical bar segmentation graph
#Business Introduction #Business Strategy #Graph
-

Vanity vs. Crisis Metric Slide – 2-Panel Dark Green & Red
#Business Strategy #Graph #Achievements
-

Four Color Infographic Vertical Bar Segmentation Graph – Business Strategy
#Business Strategy #Market and Competitor Analysis #Graph
-

Modern Business PowerPoint Template – Business Strategy and Market Analysis
#Business Strategy #Market and Competitor Analysis #Graph
