Business Forest Wide Template Vertical Bar Chart – Visualizing Business Strategy
RJ0200026_32
- Last Update 04/04/2025
- File Size 0.6MB
- # of Slides 2
- File Format PPTX
- Slide Ratio 16:9
- Color
Keywords
About the Product
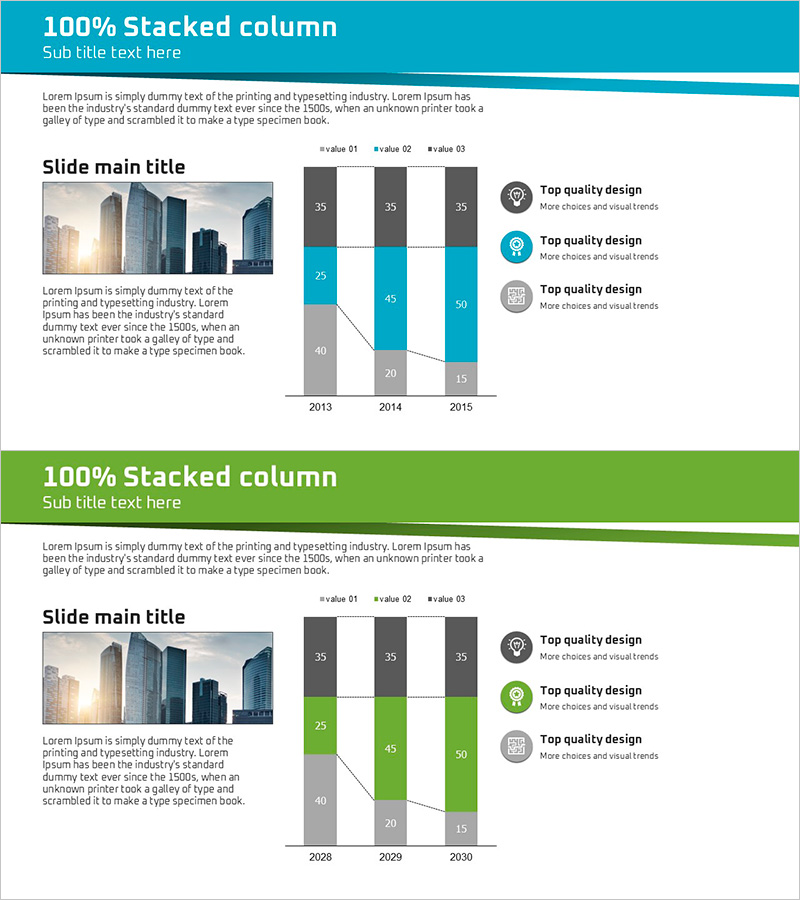
A vertical bar chart PowerPoint slide designed to clearly present business progress and performance metrics. This slide template features three data series displayed side-by-side for year-over-year or period-over-period comparison, making it ideal for visualizing sales trends, strategic initiatives, and operational achievements. The color scheme combines teal, gray, and blue tones to create a professional business presentation atmosphere. Includes legend and value labels for enhanced clarity and audience comprehension. Ready-to-use 2-slide template for immediate deployment in executive presentations.
Usage Points
-
Main Usage
Enables simultaneous comparison and analysis of three or more data series across time periods, such as annual business performance, marketing metrics, or revenue trends. Serves as a critical slide in executive reports, business plans, and quarterly performance presentations to support data-driven decision-making.
-
How to Use
The bar heights and color differentiation allow intuitive understanding of numerical differences across series. The legend clarifies the meaning of each series, while value labels provide precise figures. When paired with narrative explanation of trends across time periods, this slide significantly enhances audience comprehension and engagement.
-
Recommended For
Ideal for executives, business managers, marketing directors, financial analysts, and consultants presenting in board meetings, investor briefings, quarterly reviews, and business proposals. Particularly effective when multiple metrics require simultaneous comparison during strategic planning phases.
-
Slide Structure
2-slide template with teal header on slide 1 featuring 3-series vertical bar chart (2013-2015 data with 3 bars per year) and green header on slide 2 with identical chart structure (2028-2030 data). Left side contains building image and descriptive text; right side displays chart with legend and 3 quality design icons.
Related Products
-

Fantastic Wide PPT Vertical Bar Segmentation Chart – Visualization of Business Strategy
#Business Introduction #Business Strategy #Graph
-

Vanity vs. Crisis Metric Slide – 2-Panel Dark Green & Red
#Business Strategy #Graph #Achievements
-

Four Color Infographic Vertical Bar Segmentation Graph – Business Strategy
#Business Strategy #Market and Competitor Analysis #Graph
-

Geometry PPT Template Wide Vertical bar segmentation graph
#Business Introduction #Business Strategy #Graph
