Modern Business PowerPoint Template – Business Strategy and Market Analysis
RJ0200028_12
- Last Update 04/05/2025
- File Size 8.4MB
- # of Slides 2
- File Format PPTX
- Slide Ratio 16:9
- Color
Keywords
- #Content-Based Slides
- #Design-Based Slides
- #Business Strategy
- #Market and Competitor Analysis
- #Graph
- #Other
- #Future Outlook
- #Column
- #Segmented Column
- #Mockup
- #Project Progress
- #16:9
- #stacked bar chart PowerPoint
- #cumulative bar graph presentation
- #3-year trend comparison slide
- #business progress analysis chart
- #PowerPoint graph slide template
About the Product
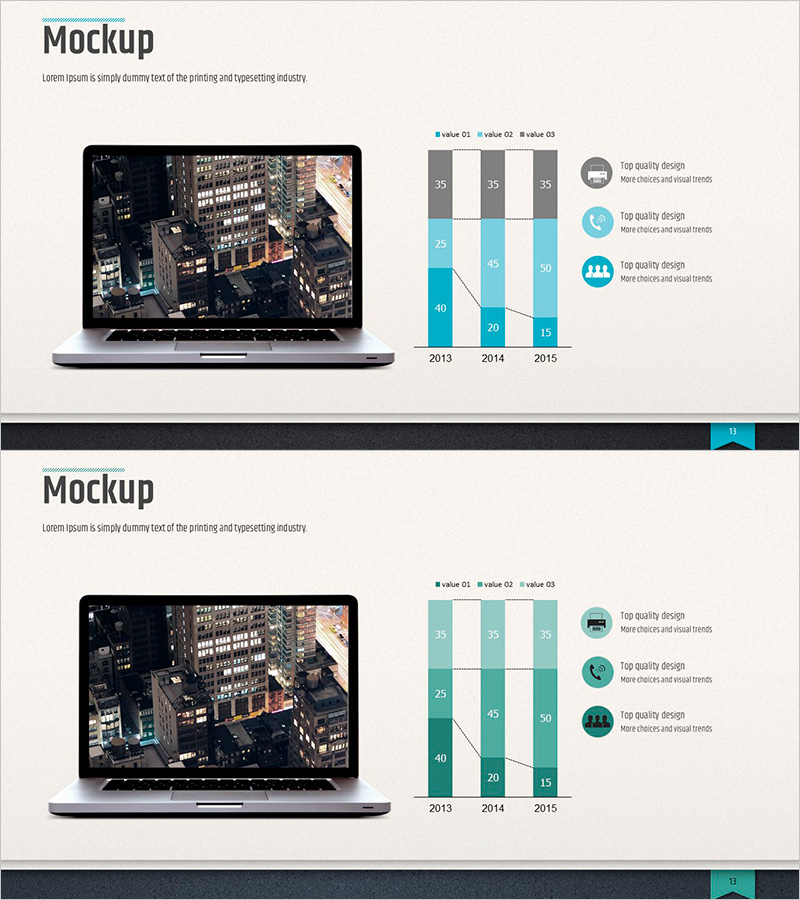
A stacked bar chart PowerPoint slide designed to visualize business progress and market analysis over time. This presentation template displays year-over-year changes across three data series from 2013 to 2015 using a cumulative bar format in light blue, sky blue, and dark blue color gradients. The right side features circular icons with descriptive text labels that clarify the meaning of each metric. An overlaid line chart simultaneously represents the overall trend, allowing viewers to grasp both individual values and aggregate patterns at a glance. The 2-slide deck in 16:9 widescreen format is ready to use immediately in various presentation scenarios.
Usage Points
-
Main Usage
Visualizes and compares year-over-year performance metrics of business initiatives. The stacked structure displays both individual component values and total aggregates simultaneously, while the overlay line emphasizes overall trajectory to strengthen persuasiveness in decision-making presentations.
-
How to Use
Apply this slide in business plans, management reports, and investor pitch decks within the performance comparison section. Replace each color series with actual metrics such as revenue, profit, or customer count, and the professional analytical presentation is instantly ready for delivery.
-
Recommended For
Ideal for executives, business managers, and marketing teams presenting quarterly reports or annual performance reviews. Particularly effective when emphasizing multi-metric time-series changes, and recommended for data-driven industries such as consulting, finance, and manufacturing.
-
Slide Structure
Two-slide composition with stacked bar chart (2013–2015 data) on the left, trend line overlay in the center, and three circular icons with text legend on the right. Light blue, sky blue, and dark blue gradient colors distinguish data series clearly, optimized for 16:9 widescreen display.
Related Products
-

Orange Hexagon Template – Segmented Horizontal Bar Graph
#Business Strategy #Market and Competitor Analysis #Graph
-

Camping Business Trend Graph – Future and Vision
#Market and Competitor Analysis #Graph #Customer Analysis
-

Visualizing Market Analysis with Modern Blue Line Chart – Digital Marketing Strategy
#Market and Competitor Analysis #Graph #Other
-

Cartoon Theme Vertical Bar Segmentation Graph – Vision and Growth
#Market and Competitor Analysis #Graph #Future Outlook
