Geometry PPT Template Wide Vertical bar segmentation graph
RJ0200034_20
- Last Update 04/07/2025
- File Size 0.1MB
- # of Slides 2
- File Format PPTX
- Slide Ratio 16:9
- Color
Keywords
About the Product
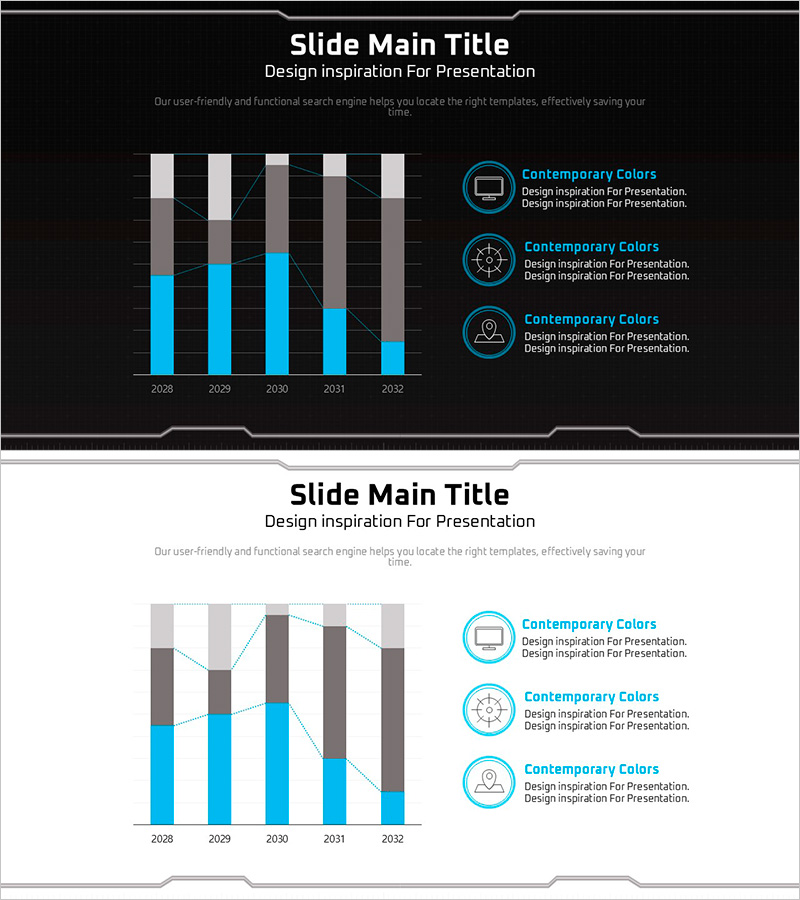
A vertical bar segmented chart PowerPoint slide designed to visualize business progress and performance metrics over time. This slide template displays data from 2028 to 2032 across five years, divided into two data series with a dark background and cyan blue accent color for high-contrast visual impact. The geometric frame decoration and right-side icon explanation area enable effective communication of business performance, revenue trends, goal achievement rates, and other key metrics. Formatted in 16:9 widescreen ratio with 2 slides in editable PPTX format, allowing quick customization for presentations, reports, and strategic reviews.
Usage Points
-
Main Usage
Visualizes year-over-year business performance, revenue trends, goal achievement rates, and departmental results comparison. The two-series segmented bar structure allows simultaneous comparison of two metrics within the same time period, while the dark background high-contrast color scheme is ideal for executive briefings and key business meetings.
-
How to Use
Apply this slide in business progress reports, quarterly and annual performance presentations, marketing campaign result analysis, and financial performance explanations. Add key insights or major achievements to the right icon area to enhance data interpretation, enabling intuitive color and numerical comparison across time periods.
-
Recommended For
Executive briefings, business performance presentations, investor relations meetings, quarterly results sharing, marketing team reviews, and financial analysis presentations. Particularly suitable for executives, business managers, marketing professionals, financial analysts, and stakeholders requiring data-driven decision-making.
-
Slide Structure
Two-slide template featuring a vertical bar segmented chart with 5 years (2028–2032) and 2 data series positioned centrally, with 3 icon explanation items on the right side. Dark background with geometric frame decoration at top and bottom creates a premium appearance, while cyan blue and gray tones maximize data readability and visual hierarchy.
Related Products
-

Fantastic Wide PPT Vertical Bar Segmentation Chart – Visualization of Business Strategy
#Business Introduction #Business Strategy #Graph
-

Effectively Visualized Slide of Business Trends
#Business Introduction #Business Strategy #Diagram
-

Analysis Graph for Child – Market Trends
#Business Introduction #Market and Competitor Analysis #Graph
-

Business Forest Wide Template Vertical Bar Chart – Visualizing Business Strategy
#Business Strategy #Graph #Column
