Fantastic Wide Table Slide – Financial Planning and Performance
RJ0200049_18
- Last Update 04/12/2025
- File Size 0.5MB
- # of Slides 2
- File Format PPTX
- Slide Ratio 16:9
- Color
Keywords
- #Content-Based Slides
- #Design-Based Slides
- #Financial Plans and Performance
- #Diagram
- #Balance Sheet
- #Budget
- #Table
- #16:9
- #financial table PowerPoint slide
- #financial data comparison template
- #3-column budget table slide
- #how to create a financial report in PowerPoint
- #financial performance analysis PPT
About the Product
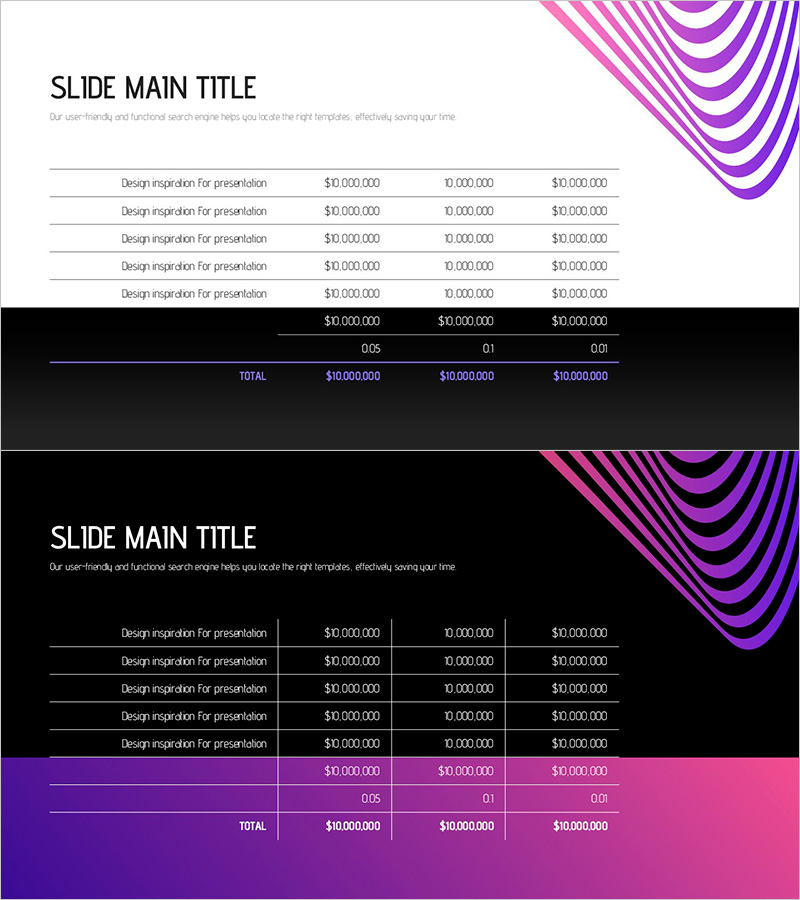
A 2-slide table set designed to clearly compare and analyze financial planning and performance metrics. Available in two versions: light background (white-based) and dark background (black-based), each featuring 5 data rows and 3 columns for numerical input. A purple-to-pink gradient curve accent in the upper right corner provides visual emphasis, while subtotal, ratio, and total rows are highlighted at the bottom. The table format is fully editable in PowerPoint, making it ideal for budget presentations, balance sheets, income statements, and performance comparisons in financial reporting.
Usage Points
-
Main Usage
Organize financial data (budgets, actuals, ratios, totals) in table format to present decision-making evidence clearly. Effectively communicate numerical comparisons and performance analysis to investors, executives, and stakeholders.
-
How to Use
Use the light version in bright meeting rooms and projector settings; use the dark version in low-light environments and online presentations. Enter budget, actual, variance, and total figures into each cell, and adjust colors and font sizes as needed for emphasis.
-
Recommended For
CFOs, finance managers, and executives presenting quarterly or annual financial performance, or demonstrating financial health in investment pitch decks. Optimized for the financial section of business plans, reports, and proposals.
-
Slide Structure
Each slide contains one title area, one 5-row × 3-column data table, and one highlighted row for subtotals, ratios, and totals. The light version features gray dividing lines and black text; the dark version uses purple-pink accent rows and white text for differentiation.
Related Products
-

Yellow Brown Table Chart – Visualizing Financial Plans and Performance
#Financial Plans and Performance #Diagram #Balance Sheet
-

Visualizing Financial Plans with an Orange-Green Table – Budget and Performance
#Financial Plans and Performance #Diagram #Balance Sheet
-

Travel Budget and Expense Planning Slide
#Financial Plans and Performance #Diagram #Capital Requirements
-

Cost Increase Rate Analysis Chart
#Financial Plans and Performance #Diagram #Graph
