Visualizing Financial Plans with an Orange-Green Table – Budget and Performance
RJ0600012_9
- Last Update 06/24/2025
- File Size 0.1MB
- # of Slides 2
- File Format PPTX
- Slide Ratio 16:9
- Color
Keywords
About the Product
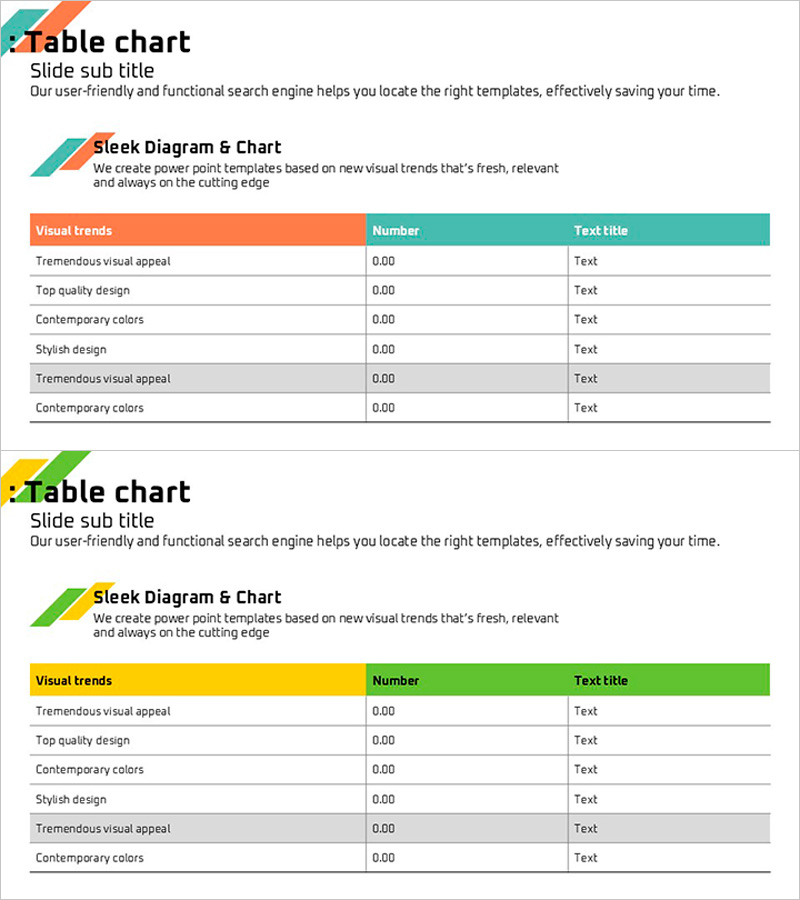
A 3-column financial table PowerPoint slide designed to compare budget and actual performance at a glance. The orange and green dual-tone header strengthens visual distinction, clearly organizing budget, actual, and variance items. The 2-slide set accommodates various financial data including revenue, expenses, profit margins, and cash flow, optimized for 16:9 widescreen format. Instantly applicable to financial presentations, quarterly reports, business plans, and investor communications where numerical data clarity is essential.
Usage Points
-
Main Usage
Visualizes financial data (budget, actual, variance) in a structured table format to enable stakeholders to grasp financial status instantly. The orange-green dual-tone header provides clear distinction between columns, enhancing credibility of numerical information delivery.
-
How to Use
Used in financial reports, quarterly earnings presentations, business plans, and investor briefings to compare budget versus actual performance. Input various financial metrics such as revenue, expenses, profit margins, cash flow, debt, and assets to communicate financial status persuasively to executives, boards, and investors.
-
Recommended For
CFOs, finance managers, executives, investor relations specialists, and accounting teams analyzing and reporting financial performance. Ideal for public company quarterly earnings announcements, SME business plans, bank loan applications, consulting reports, and documents where financial credibility is critical.
-
Slide Structure
2-slide set. Each slide features a 3-column (Budget, Actual, Variance) × 6-row (item label + 5 data rows) table structure. Headers are dual-tone orange (left) and green (right), with data rows alternating white and gray backgrounds for readability. Optimized for 16:9 widescreen format.
Related Products
-

Yellow Brown Table Chart – Visualizing Financial Plans and Performance
#Financial Plans and Performance #Diagram #Balance Sheet
-

Travel Budget and Expense Planning Slide
#Financial Plans and Performance #Diagram #Capital Requirements
-

Budget Table for Financial Analysis – Concise and Clear Data Presentation
#Financial Plans and Performance #Diagram #Budget
-

Rhombus Presentation Template Table Chart – Optimized for Financial Planning and Performance
#Financial Plans and Performance #Diagram #Budget
