Yellow Brown Table Chart – Visualizing Financial Plans and Performance
RJ0900004_10
- Last Update 08/16/2025
- File Size 0.4MB
- # of Slides 2
- File Format PPTX
- Slide Ratio 16:9
- Color
Keywords
About the Product
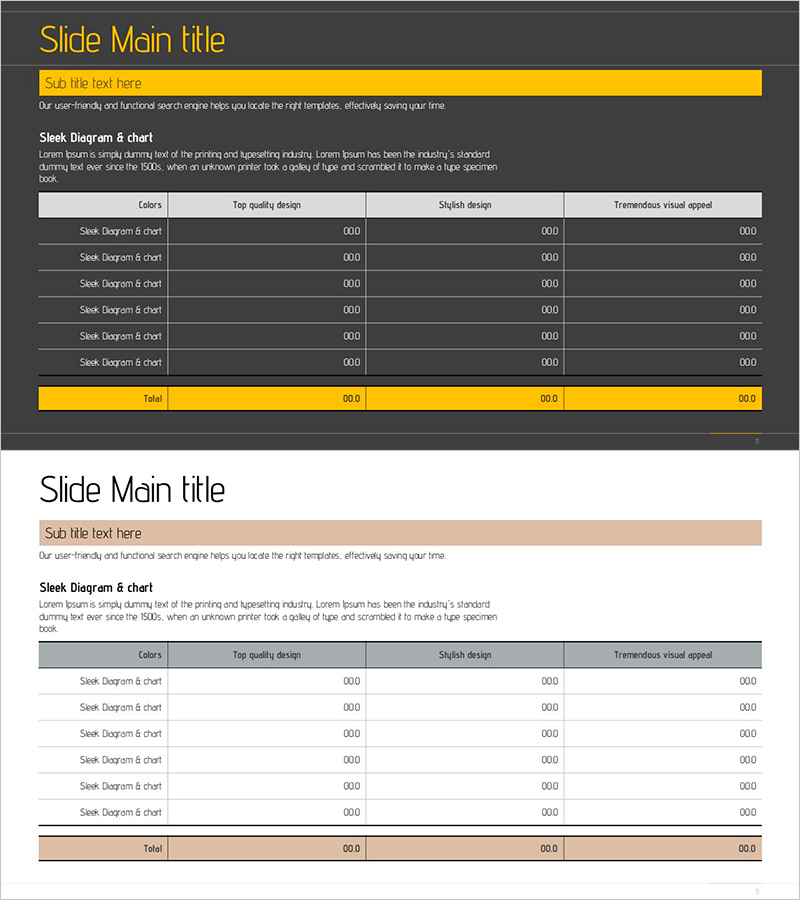
A 6-row table chart PowerPoint slide designed to clearly compare and analyze financial plans and performance metrics. Featuring a yellow header row and brown accent cells, this slide effectively organizes budget figures, actual results, variances, and other financial indicators. The 2-slide set enables side-by-side comparison of diverse financial data and is ready to use in balance sheets, income statements, budget reports, and financial presentations. Each cell is fully editable, making it suitable for displaying company financial status, quarterly performance, departmental budgets, and other data-driven analyses.
Usage Points
-
Main Usage
Organize financial data, budget figures, quarterly results, and departmental performance into structured rows and columns for numerical comparison. The yellow header row and brown accent cells visually distinguish key items and direct audience attention to critical financial metrics.
-
How to Use
Use in financial reports, business plans, quarterly earnings presentations, and budget planning meetings to present numerical data in table format. Simply input actual figures into each cell for immediate presentation use, and customize colors and fonts as needed.
-
Recommended For
CFOs, finance managers, executives, controllers, accounting teams, and budget departments presenting financial status and performance data. Ideal for regular financial reporting, investor presentations, and internal management meetings requiring credible data visualization.
-
Slide Structure
2-slide set with each slide containing a 6-row × 4-column table structure. The first row features a yellow header for item labels, followed by 5 data rows. The final row uses a brown background for totals and summary figures, while the rightmost 3 columns are designed for numerical comparison and variance analysis.
Related Products
-

Visualizing Financial Plans with an Orange-Green Table – Budget and Performance
#Financial Plans and Performance #Diagram #Balance Sheet
-

Green Standard Table – Financial Planning and Budget Analysis
#Financial Plans and Performance #Diagram #Budget
-

Budget Table for Financial Analysis – Concise and Clear Data Presentation
#Financial Plans and Performance #Diagram #Budget
-

Travel Budget and Expense Planning Slide
#Financial Plans and Performance #Diagram #Capital Requirements
