Country-by-Country Bar Chart Analysis – Market Trend Insights
RJ0300067_11
- Last Update 05/06/2025
- File Size 1.5MB
- # of Slides 2
- File Format PPTX
- Slide Ratio 16:9
- Color
Keywords
- #Content-Based Slides
- #Design-Based Slides
- #Company Introduction
- #Market and Competitor Analysis
- #Graph
- #Other
- #Global Network
- #Target Market
- #Column
- #Column Chart
- #Map
- #16:9
- #world map PowerPoint slide
- #regional bar chart template
- #global data visualization
- #international market analysis slide
- #geographic chart download
About the Product
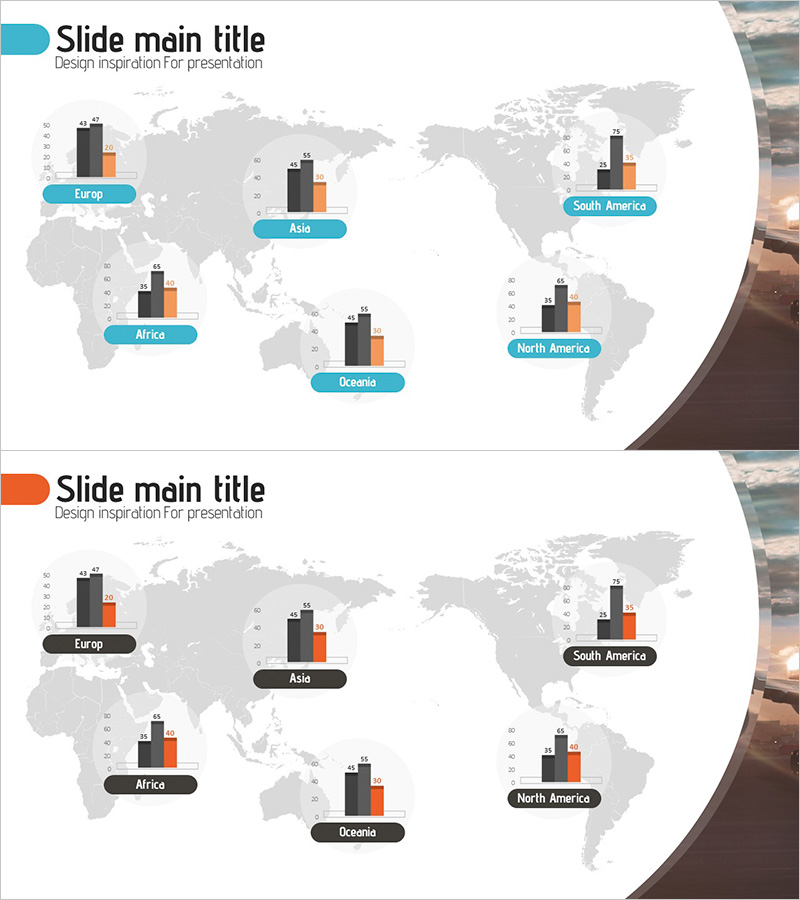
A PowerPoint slide featuring a world map with bar charts positioned across five global regions (Europe, Asia, Africa, Oceania, North America, South America). Each region displays dual-series bar charts in dark gray and orange to compare regional data, with teal-colored labels highlighting region names. The 16:9 widescreen format includes 2 slides ideal for global market analysis, regional performance comparison, and international business presentations. The brown curved design element on the background adds professional polish, while all data values and labels are fully editable for customization across various industry reports and business contexts.
Usage Points
-
Main Usage
Visualize global market conditions, regional performance metrics, and international business data using map-based bar charts to enhance audience comprehension. Simultaneous comparison of five regions reveals regional differences and trends at a glance.
-
How to Use
Apply to executive reports, international marketing strategy presentations, global sales performance analysis, and regional business expansion planning. Edit bar chart values and region labels with your own data to create customized presentation materials.
-
Recommended For
International business managers, marketing strategy teams, sales directors, management consultants, and market research analysts presenting data-driven decisions on global operations and expansion.
-
Slide Structure
Slide 1: World map background with 5 regions marked and dual-series bar charts (dark gray and orange) positioned at each location. Slide 2: Identical layout with alternative label styling (black labels). All numerical values, region names, and legend elements are fully editable.
Related Products
-

Global Regional Analysis Vertical Bar Graph - Insights from Regional Data
#Company Introduction #Market and Competitor Analysis #Graph
-

Target Market Analysis World Map & Bar Graph
#Company Introduction #Market and Competitor Analysis #Graph
-

Global Network Map – Market Analysis and Opportunity Exploration
#Company Introduction #Market and Competitor Analysis #Other
-

Global Market Analysis Map – Importance of Market Connectivity
#Company Introduction #Market and Competitor Analysis #Graph
