Visualizing Sales Status of Specific Districts with Horizontal Bar Chart
RJ0900020_27
- Last Update 08/21/2025
- File Size 6.6MB
- # of Slides 2
- File Format PPTX
- Slide Ratio 16:9
- Color
Keywords
- #Content-Based Slides
- #Design-Based Slides
- #Company Introduction
- #Financial Plans and Performance
- #Graph
- #Other
- #Global Network
- #Sales and Revenue
- #Column
- #Column Chart
- #Map
- #16:9
- #world map PowerPoint slide
- #regional sales analysis presentation
- #geographic data visualization
- #global market map template
- #horizontal bar chart slide
About the Product
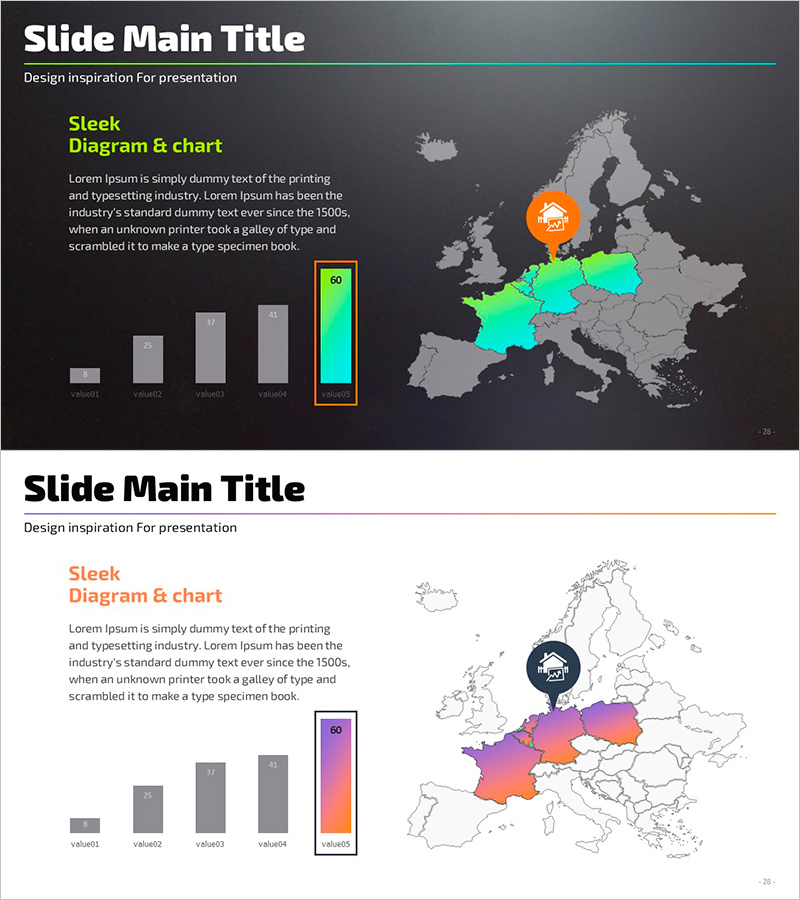
A PowerPoint slide template that visualizes regional sales performance across Europe using an interactive world map. The design features a dark background with four distinct colors—orange, lime, cyan, and purple—to differentiate geographic regions, while a central orange circular icon highlights the key market area. A horizontal bar chart on the left displays comparative sales data across four value categories. The 2-slide set includes both dark and light theme versions, making it adaptable to various presentation environments. Perfect for business presentations covering regional performance analysis, global marketing strategy, international sales reports, and geographic market expansion.
Usage Points
-
Main Usage
Designed to communicate regional and country-level sales performance, market share, and business metrics across global markets using geographic visualization. The color-coded map combined with numerical bar chart data enables quick comprehension and supports data-driven decision-making in international business contexts.
-
How to Use
Customize the map colors and legend to match your regional data, then input your sales figures into the horizontal bar chart. Choose between the dark or light background version depending on your presentation environment. Use the orange circular icon to emphasize your primary market region.
-
Recommended For
Ideal for sales and marketing teams presenting quarterly or annual regional performance reports, global subsidiary results, international market expansion strategies, and investor presentations. Recommended for regional directors, international sales teams, business development managers, and executive leadership in multinational organizations.
-
Slide Structure
Slide 1 (Dark Theme): Dark gray background with Europe map positioned on the right, four-category horizontal bar chart (value01–value04) on the left, orange circular icon at top center. Slide 2 (Light Theme): White background with identical layout; map regions differentiated by orange, lime, cyan, and purple; bar chart bars in unified gray tones.
Related Products
-

Target Country Analysis Bar Graph – Insights into Global Markets
#Company Introduction #Market and Competitor Analysis #Graph
-

Country-by-Country Bar Chart Analysis – Market Trend Insights
#Company Introduction #Market and Competitor Analysis #Graph
-

Global Country Analysis Vertical Bar Graph – Market and Competitor Analysis
#Company Introduction #Market and Competitor Analysis #Graph
-

Global Regional Analysis Vertical Bar Graph - Insights from Regional Data
#Company Introduction #Market and Competitor Analysis #Graph
