Fantastic Wide PPT Table – Detailed Financial Planning & Performance
RJ0200049_11
- Last Update 04/12/2025
- File Size 0.5MB
- # of Slides 2
- File Format PPTX
- Slide Ratio 16:9
- Color
Keywords
- #Content-Based Slides
- #Design-Based Slides
- #Financial Plans and Performance
- #Diagram
- #Income Statement
- #Sales and Revenue
- #Table
- #Standard Table
- #16:9
- #financial data table PowerPoint
- #financial planning slide template
- #performance comparison chart
- #budget visualization PPT
- #data table diagram slide
About the Product
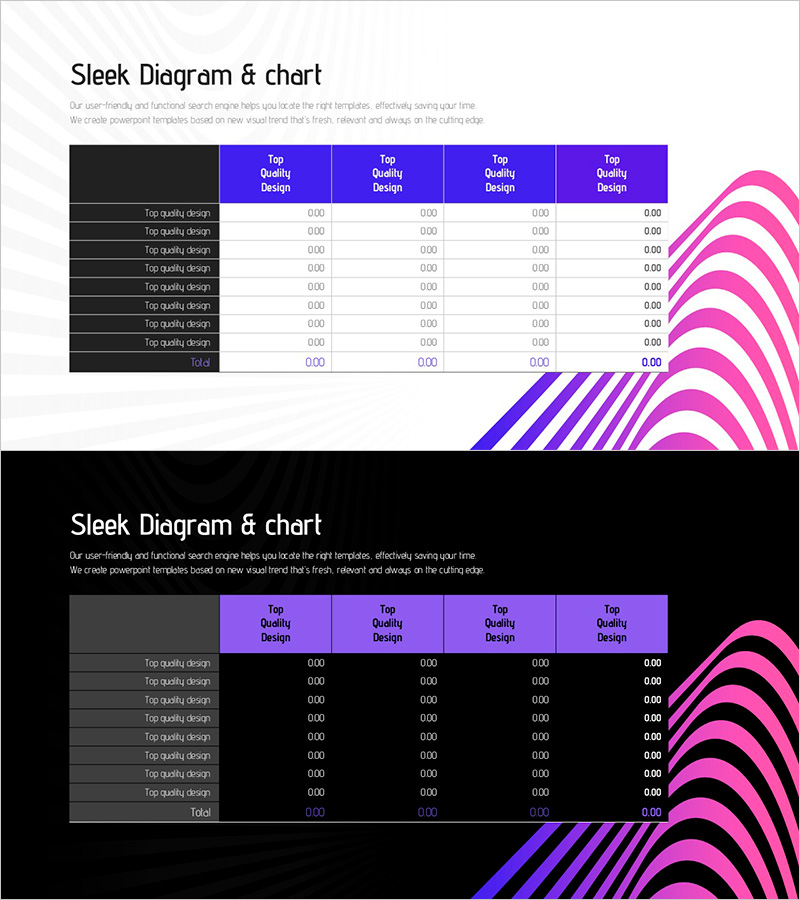
A 2-slide PowerPoint presentation combining financial planning and performance metrics in a single visual format. The first slide features a 4-column data table with labeled rows for systematic financial information organization. The second slide integrates the same table structure with a pie chart showing proportional breakdown and a striped diagram illustrating trends over time. The design uses a blue and magenta two-tone background with white typography and clear dividing lines for optimal readability. Optimized for 16:9 widescreen format, this template is ready for immediate use in financial reports, quarterly reviews, and budget presentations.
Usage Points
-
Main Usage
Organize financial metrics and performance indicators in a structured table format while simultaneously visualizing proportional relationships through pie charts and trend patterns via striped diagrams. Ideal for financial planning presentations, quarterly performance reviews, budget allocation reports, and data-driven decision-making sessions.
-
How to Use
Enter financial data, item names, and numerical values into the first slide's table structure. Use the second slide's pie chart to represent budget allocation percentages and the striped diagram to show monthly or quarterly performance trends. Maintain the blue-magenta color scheme while updating only the data values for immediate presentation use.
-
Recommended For
CFOs and finance managers presenting financial status to executives and boards, marketing teams sharing budget execution reports, project managers analyzing cost-to-performance ratios, and finance teams conducting quarterly reviews. Particularly suited for periodic financial reports, quarterly earnings presentations, and budget review meetings.
-
Slide Structure
Slide 1: Dark gray row labels on left + 4 blue column headers (Top Quality Design) + 8 data entry rows. Slide 2: Identical table structure on left + pie chart (magenta gradient 4-segment) on right + striped diagram (blue-magenta alternating pattern). 16:9 widescreen format, 2-slide set.
Related Products
-

Orange Green Profit and Loss Chart – Visualizing Revenue and Profit
#Financial Plans and Performance #Diagram #Graph
-

Business Income Statement Table – An Essential Tool for Performance Analysis
#Financial Plans and Performance #Diagram #Income Statement
-

Sales and Profit Analysis Chart – An Effective Tool for Financial Performance
#Financial Plans and Performance #Diagram #Income Statement
-

Business Income Statement – Visualizing Financial Performance
#Financial Plans and Performance #Diagram #Income Statement
