Stylish Design for Data Visualization – Business Insights
RJ0300080_9
- Last Update 05/11/2025
- File Size 0.2MB
- # of Slides 2
- File Format PPTX
- Slide Ratio 16:9
- Color
Keywords
- #Content-Based Slides
- #Design-Based Slides
- #Financial Plans and Performance
- #Diagram
- #Income Statement
- #Sales and Revenue
- #Table
- #Standard Table
- #16:9
- #data table PowerPoint slide
- #business data visualization
- #6-column table template
- #comparison analysis slide
- #table diagram PowerPoint
- #financial data presentation
About the Product
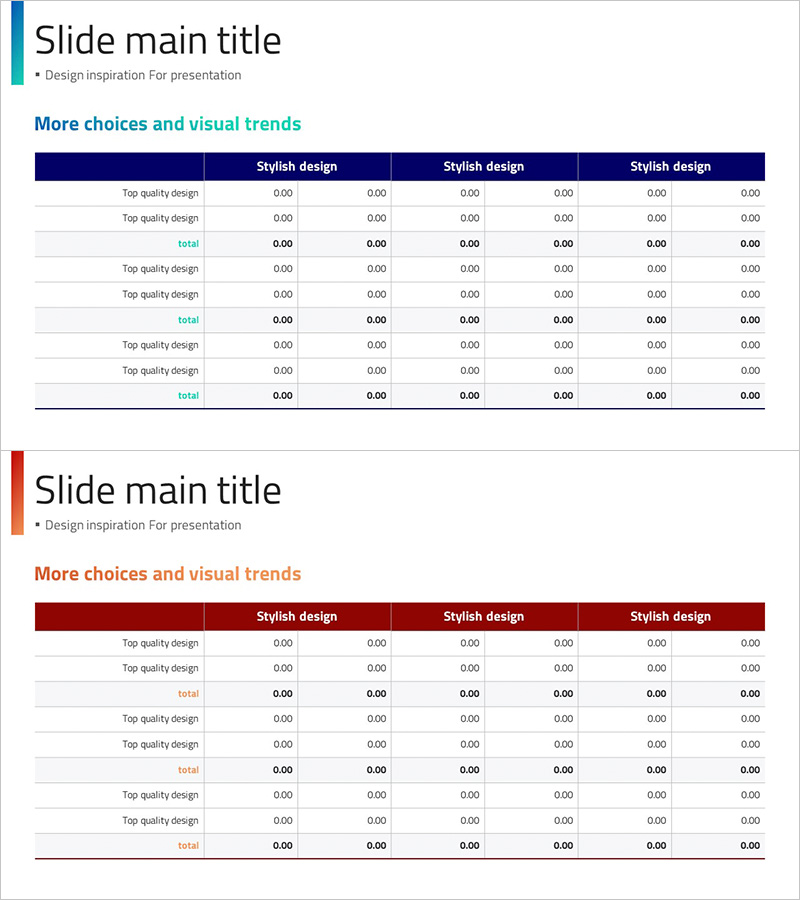
A professional 6-column table structure PowerPoint slide designed for clear data organization and comparative analysis of business metrics. The dark blue header row and white background create strong visual contrast, enhancing information hierarchy and readability. The 2-slide set allows you to present multiple datasets or repeat the same layout for consistency. Optimized for displaying sales performance, quality indicators, market analysis, and financial summaries, this presentation template integrates seamlessly into reports, proposals, and executive briefings.
Usage Points
-
Main Usage
Organize quantitative business data (revenue, customer count, market share, quality metrics) in a structured matrix format to enable clear comparative analysis. The dark blue header row emphasizes column titles, while horizontal dividing lines segment data blocks to create visual hierarchy and improve information comprehension.
-
How to Use
Insert into report performance sections, proposal competitive comparison pages, or investor presentation financial overview slides. Customize by entering your data into cells, adding or removing rows and columns as needed, and adjusting colors to match corporate branding guidelines.
-
Recommended For
Finance managers, marketing analysts, project managers, and business executives preparing quarterly reports, performance reviews, market research presentations, and investor communications. Ideal for data-driven decision-making meetings and formal business presentations requiring credibility and clarity.
-
Slide Structure
2-slide set with identical 6-column × 8-row (including header) table layout on each slide. Features dark blue header row, white data cells, and light gray dividing lines optimized for 16:9 widescreen format. All cells support text and numeric input for flexible data entry.
Related Products
-

Table of Contents for Business Success – Financial Planning and Performance
#Financial Plans and Performance #Diagram #Income Statement
-

Sleek Infographic: Modern Colors and Chart Slide Design
#Financial Plans and Performance #Diagram #Income Statement
-

Sales and Profit Calculation Table – Key to Profit Management
#Financial Plans and Performance #Diagram #Income Statement
-

Sales and Profit Table – Clear Visualization of Financial Planning
#Financial Plans and Performance #Diagram #Other
