Bar Chart Slide for Current Status of Traditional Temples
RJ0800022_16
- Last Update 08/05/2025
- File Size 2.4MB
- # of Slides 2
- File Format PPTX
- Slide Ratio 16:9
- Color
Keywords
- #Content-Based Slides
- #Design-Based Slides
- #Market and Competitor Analysis
- #Financial Plans and Performance
- #Graph
- #Competitive Advantage
- #Sales and Revenue
- #Column
- #Column Chart
- #16:9
- #horizontal bar chart PowerPoint
- #bar graph slide template
- #data comparison chart
- #numerical visualization template
- #10-item bar chart slide
About the Product
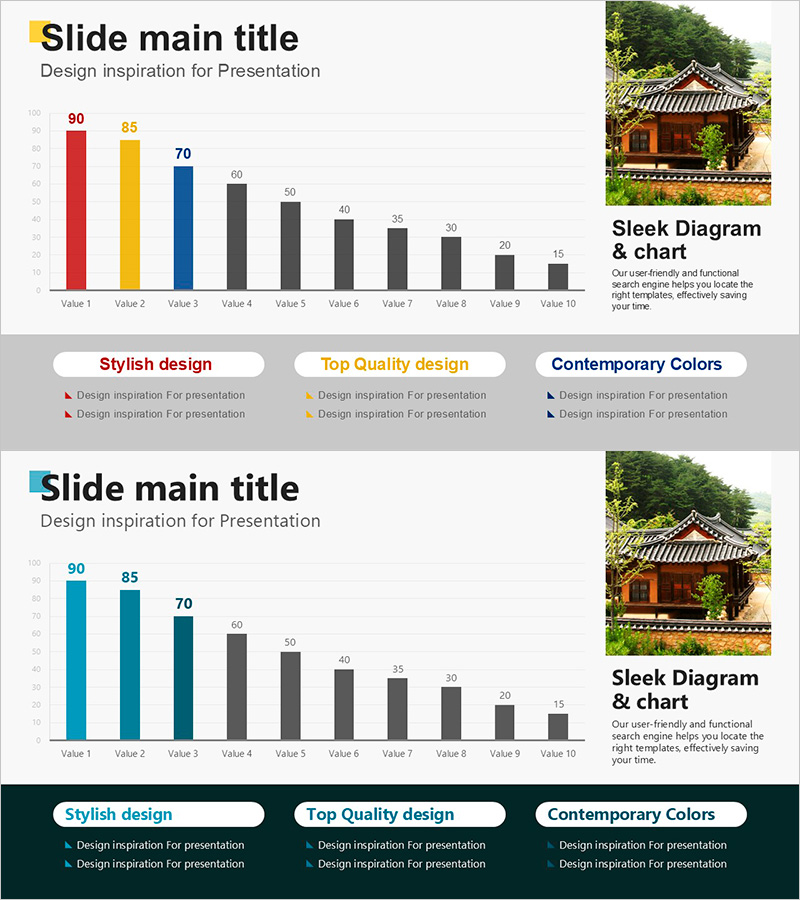
A horizontal bar chart PowerPoint slide designed to visualize traditional temple status, market analysis, and goal achievement metrics. The slide displays 10 data items using four distinct colors—red, yellow, blue, and gray—enabling instant visual comparison of numerical values. Each bar clearly represents data points ranging from 0 to 100, making it ideal for business presentations, reports, and planning documents. The 16:9 widescreen format with 2-slide structure is optimized for data comparison and insight delivery in professional presentations.
Usage Points
-
Main Usage
Enables clear comparison of multiple data items and effectively communicates rankings, performance metrics, and current status. The three primary colors (red, yellow, blue) combined with gray accents create visual hierarchy, capturing audience attention during presentations and facilitating data-driven discussions.
-
How to Use
Replace the default item names (Value 1–10) and numerical values (90, 85, 70, etc.) with your actual data. Adjust bar lengths and colors to match your presentation theme. Suitable for business status reports, market share analysis, performance comparisons, and budget allocation presentations with minimal customization.
-
Recommended For
Marketing professionals, business analysts, financial managers, project managers, and executives presenting performance reports, market analysis, and goal achievement metrics. Particularly useful for cultural heritage organizations, tourism boards, and traditional industry stakeholders presenting institutional status and business plans.
-
Slide Structure
Two-slide set featuring a 10-item horizontal bar chart. The first slide displays bars in red, yellow, blue, and gray representing values 1–10 (90, 85, 70, 60, 50, 40, 35, 30, 20, 15). The second slide presents the same structure in teal/cyan color variant. Both slides include three feature callouts at the bottom: 'Stylish Design', 'Top Quality Design', and 'Contemporary Colors' with supporting bullet points.
Related Products
-

India Travel Vertical Bar Graph – Visual Appeal of Green and Red
#Market and Competitor Analysis #Financial Plans and Performance #Graph
-

Typographic Wide Template Bar Chart & Table – Competitive Analysis and Performance
#Market and Competitor Analysis #Financial Plans and Performance #Diagram
-

Highlighted Vertical Bar Graph (Green & Orange) – Clear Visualization for Data Comparison
#Market and Competitor Analysis #Financial Plans and Performance #Graph
-

Orange Hexagon Presentation Template Vertical Bar Graph
#Market and Competitor Analysis #Financial Plans and Performance #Graph
