Orange Hexagon Presentation Template Vertical Bar Graph
RJ0200038_26
- Last Update 04/08/2025
- File Size 1.2MB
- # of Slides 2
- File Format PPTX
- Slide Ratio 16:9
- Color
Keywords
- #Content-Based Slides
- #Design-Based Slides
- #Market and Competitor Analysis
- #Financial Plans and Performance
- #Graph
- #Competitive Advantage
- #Sales and Revenue
- #Column
- #Column Chart
- #16:9
- #vertical bar chart PowerPoint
- #bar graph slide template
- #data visualization PPT
- #numerical comparison chart
- #orange chart design
About the Product
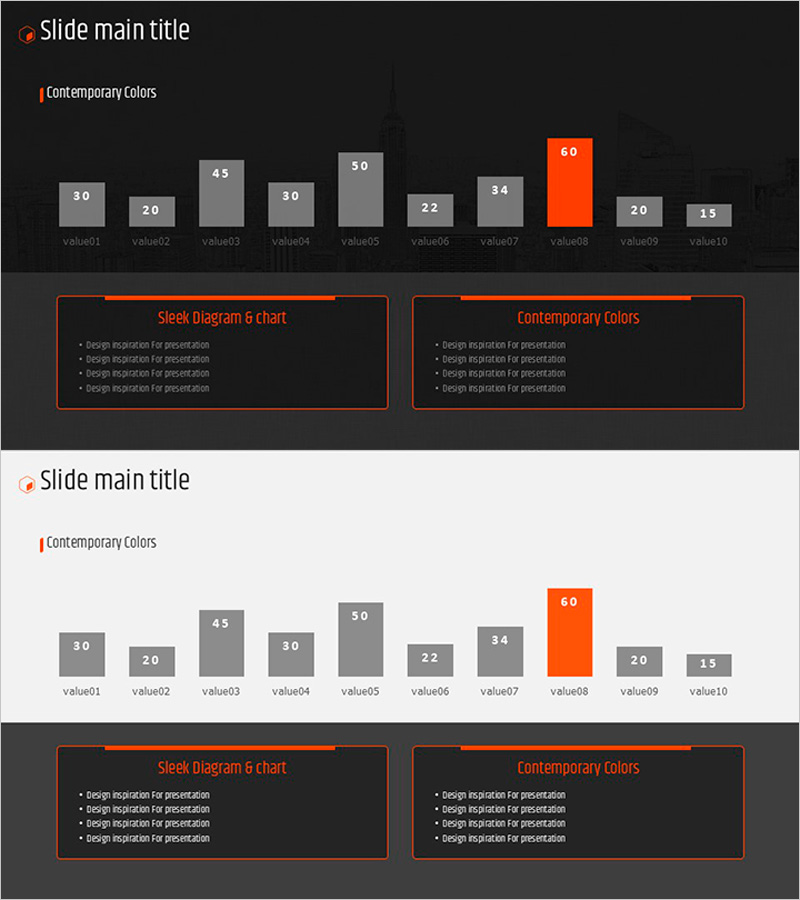
A vertical bar chart PowerPoint slide designed for comparing numerical data across 10 items. The dark background with orange accent color creates high contrast, making data values clearly visible. The layout features a hexagon text box on the left for chart explanation and an orange-bordered box on the right for key insights, forming a two-column structure. Ideal for sales figures, visitor metrics, performance indicators, and other comparative data in presentations.
Usage Points
-
Main Usage
Visualize and compare multiple numerical metrics such as sales, traffic, performance indicators, and rankings in a single view. The bar height intuitively represents data magnitude, enhancing audience comprehension and decision-making.
-
How to Use
Enter chart title and description in the left hexagon text box, and add key insights in the right orange-bordered box. Double-click the bar values to update with actual data; the chart automatically recalculates and displays the changes.
-
Recommended For
Recommended for executives, analysts, managers, and planners presenting quarterly reports, performance reviews, marketing analysis, financial updates, and project status meetings where data-driven insights are essential.
-
Slide Structure
Two-slide layout with dark background, title area at top, 10-item vertical bar chart in center (9 gray bars + 1 orange highlight bar), hexagon text box (4-line input) on lower left, and orange-bordered box (4-line input) on lower right.
Related Products
-

Typographic Wide Template Bar Chart & Table – Competitive Analysis and Performance
#Market and Competitor Analysis #Financial Plans and Performance #Diagram
-

India Travel Vertical Bar Graph – Visual Appeal of Green and Red
#Market and Competitor Analysis #Financial Plans and Performance #Graph
-

Highlighted Vertical Bar Graph (Green & Orange) – Clear Visualization for Data Comparison
#Market and Competitor Analysis #Financial Plans and Performance #Graph
-

Ranking of Popularity Vote on the Menu – Visualized with Horizontal Bar Chart
#Market and Competitor Analysis #Financial Plans and Performance #Graph
