Newspaper Wide PowerPoint Template Area Chart – Market Analysis and Strategy
RJ0200046_28
- Last Update 04/11/2025
- File Size 0.7MB
- # of Slides 2
- File Format PPTX
- Slide Ratio 16:9
- Color
Keywords
- #Content-Based Slides
- #Design-Based Slides
- #Market and Competitor Analysis
- #Marketing Plan and Strategy
- #Graph
- #Industry Trends
- #Marketing Strategy
- #Other
- #Area Chart
- #16:9
- #area chart PowerPoint
- #area graph slide template
- #trend comparison chart
- #market analysis slide
- #data visualization PowerPoint
- #how to create area chart in PowerPoint
About the Product
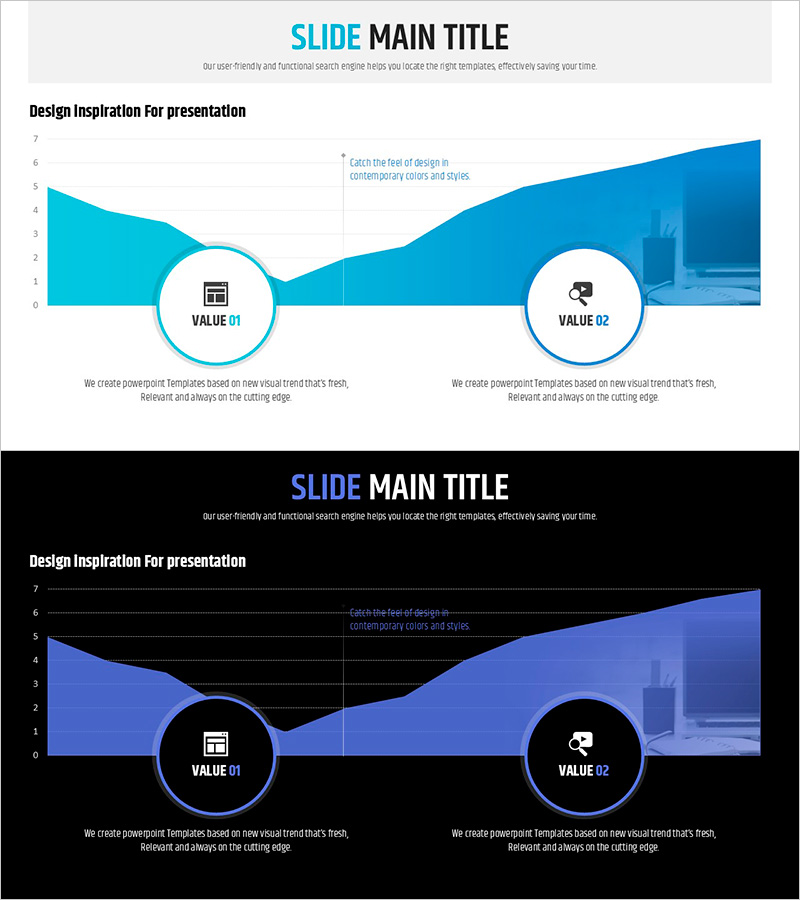
An area chart PowerPoint slide optimized for market analysis and strategic planning presentations. The dual-series area chart features a gradient blend of cyan and deep blue tones, visually representing data trends and comparative changes over time. Designed in newspaper-style layout with 16:9 widescreen format, the slide combines a left-side area chart with two circular value indicators (VALUE 01·02) on the right, enabling clear presentation of key metrics alongside explanatory text. This PowerPoint slide template is ready for immediate use in marketing reports, business analysis presentations, financial performance briefings, and data-driven corporate communications.
Usage Points
-
Main Usage
Visualizes cumulative trends and changes across two or more data series over time. Area charts effectively display both absolute values and proportional shifts relative to total composition, making them ideal for illustrating market share evolution, revenue composition trends, customer segment growth, and competitive positioning dynamics.
-
How to Use
Input actual data into the left-side area chart to update trend lines automatically. Enter key metrics or indicator names within the VALUE 01·02 circular icons on the right. Add chart interpretation and strategic insights in the bottom text area. The newspaper-style widescreen layout suits both printed reports and large-screen presentations.
-
Recommended For
Marketing professionals, financial analysts, business strategists, sales managers, and executives presenting market analysis, revenue performance, customer trends, and competitive comparisons. Ideal for quarterly and annual performance reports, investor briefings, executive dashboards, and strategic planning sessions.
-
Slide Structure
Two-slide set with consistent layout: left side features a dual-series area chart in cyan-to-blue gradient, center area contains legend and descriptive text, right side displays VALUE 01·02 circular indicators. 16:9 widescreen format with newspaper-style header provides professional data-centric presentation structure.
Related Products
-

Minimal Graph Design for Data Comparison – Enjoying a Day
#Market and Competitor Analysis #Graph #Industry Trends
-

Three-Dimensional Graph Analysis – Market and Competitor Analysis Slide
#Product/Service Introduction #Market and Competitor Analysis #Marketing Plan and Strategy
-

Management System and Area Charts – Effective Business Strategies
#Business Strategy #Market and Competitor Analysis #Diagram
-

Simple Car Wide Presentation Area Chart
#Market and Competitor Analysis #Graph #Other
