Management System and Area Charts – Effective Business Strategies
RJ0900008_22
- Last Update 08/18/2025
- File Size 0.3MB
- # of Slides 2
- File Format PPTX
- Slide Ratio 16:9
- Color
Keywords
- #Content-Based Slides
- #Design-Based Slides
- #Business Strategy
- #Market and Competitor Analysis
- #Diagram
- #Graph
- #Other
- #Implementation Framework
- #Industry Trends
- #Spread
- #Other
- #Centralized Diagram
- #Area Chart
- #16:9
- #area chart PowerPoint
- #circular diagram slide
- #3-node diagram template
- #dual-series area chart
- #business strategy presentation
- #market analysis PowerPoint slide
About the Product
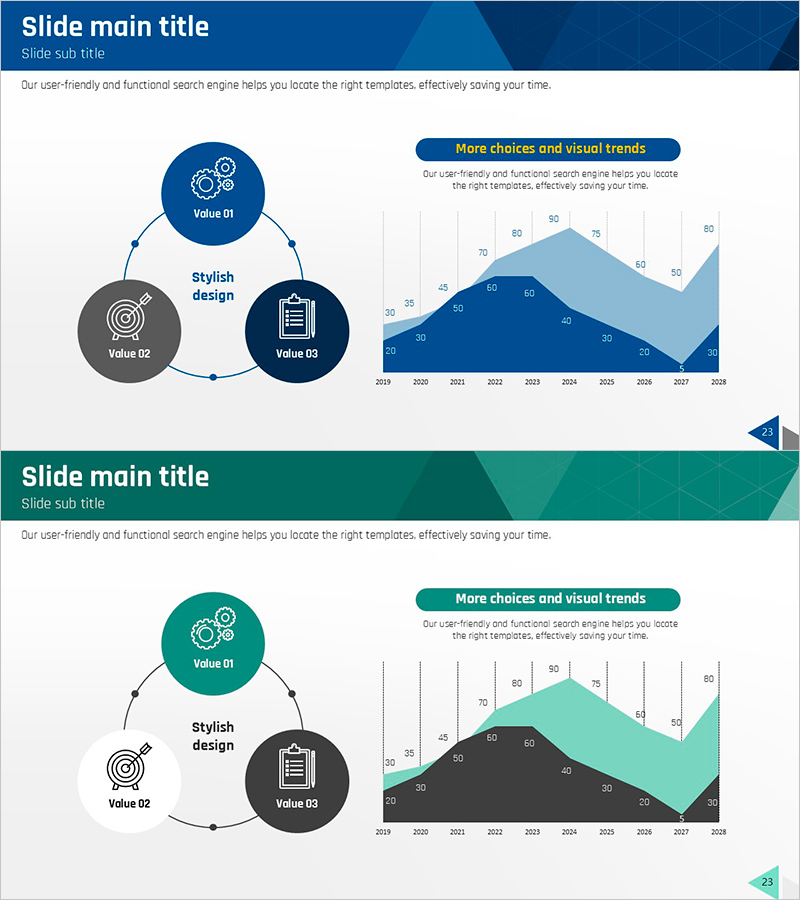
A professional PowerPoint slide featuring a 3-node circular diagram with interconnected management system values and a dual-series area chart spanning 2019–2028. The left side displays Value 01, 02, and 03 connected through gear, target, and document icons in dark blue, gray, and navy tones, illustrating organizational relationships. The right side presents a 2-series area chart with gradient fills showing 10-year trend analysis across multiple data points. Designed in 16:9 widescreen format across 2 slides, this presentation template is ready for business strategy presentations, market analysis reports, performance reviews, and executive briefings with fully editable elements.
Usage Points
-
Main Usage
Visualize three core organizational values or management system components through an interconnected circular diagram, while simultaneously displaying 10-year performance metrics or market trends using a dual-series area chart to support strategic decision-making and stakeholder communication.
-
How to Use
Input your organization's three key values, processes, or objectives into the left circular diagram nodes, populate the area chart with annual performance data or market indicators on the right, and present during executive briefings, investor relations meetings, or strategic planning sessions. All colors, labels, and data points are fully editable to match your corporate branding and datasets.
-
Recommended For
Executives, business planners, marketing teams, and financial analysts presenting quarterly or annual performance reports, market analysis findings, and strategic initiatives. Particularly suited for finance, consulting, manufacturing, and technology sectors requiring multi-series data comparison and relationship visualization.
-
Slide Structure
Slide 1: Dark blue background with 3-node circular diagram (gear, target, document icons) connected by arrows + right-side dual-series area chart (2019–2028 timeline, dark blue and light blue gradient fills). Slide 2: Identical layout in teal and gray color scheme. 16:9 aspect ratio, 2-slide PPTX format.
Related Products
-

Modern Blue Presentation Area Chart - Optimized for Market Analysis
#Market and Competitor Analysis #Graph #Other
-

Area Graph & Notebook Mockup for Market Trend Analysis
#Market and Competitor Analysis #Graph #Other
-

Simple Car Wide Presentation Area Chart
#Market and Competitor Analysis #Graph #Other
-

Area Chart for Market Trend Analysis – Insights and Growth
#Market and Competitor Analysis #Financial Plans and Performance #Graph
