Wide Area Chart for Automotive Market Trend Analysis
RJ0200044_27
- Last Update 04/10/2025
- File Size 2.8MB
- # of Slides 2
- File Format PPTX
- Slide Ratio 16:9
- Color
Keywords
About the Product
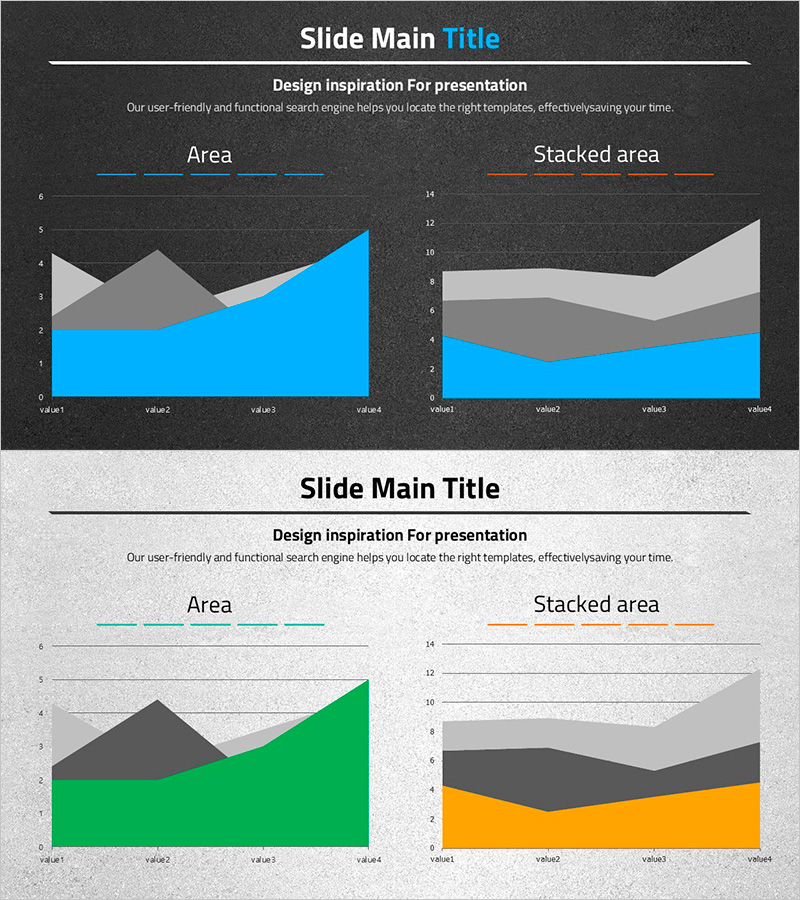
An area chart PowerPoint slide optimized for automotive market trend analysis and competitive comparison. Features two color themes: dark background with blue palette and light background with green and orange palette. Each theme includes two chart variations—standard area chart and stacked area chart—for a total of four chart designs. Supports four data series to clearly visualize time-series data and category-based trends. Provided in 16:9 widescreen PPTX format, fully editable and ready for marketing reports, business analysis presentations, and market research materials.
Usage Points
-
Main Usage
Visualizes time-series data trends and cumulative composition simultaneously using area charts. Ideal for displaying automotive sales progression, competitor market share evolution, and product category revenue composition. Enables data-driven decision-making through intuitive multi-layer data representation.
-
How to Use
Apply to market analysis sections in marketing reports, competitive analysis pages in business plans, and quarterly or annual performance presentations. Dark theme suits executive-level briefings with professional atmosphere; light theme works well for educational and seminar materials. Charts auto-update when you input data values directly.
-
Recommended For
Marketing managers, market analysts, business strategists, financial analysts, and consultants presenting market trends, sales progression, and customer segment shifts. Particularly effective for automotive, manufacturing, retail, and financial services industries conducting market analysis presentations.
-
Slide Structure
Two-slide layout. First slide features dark background with two blue area charts (standard and stacked) positioned left and right. Second slide has light background with green and orange area charts in identical layout. Each chart displays four data series, four X-axis values, and Y-axis range 0–14, optimized for comparative analysis.
Related Products
-

Typographic Wide Template Line Chart – Effective Data Visualization for Market Analysis
#Market and Competitor Analysis #Diagram #Graph
-

Market Trend Analysis Mixed Graph & Table
#Market and Competitor Analysis #Diagram #Graph
-

Competitor Analysis Broken Line Graph – Visualizing Market Trends
#Market and Competitor Analysis #Graph #Other
-

Curved Theme Purple Template Area Chart – Market Trend Analysis
#Market and Competitor Analysis #Graph #Future Outlook
