Newspaper Wide PowerPoint Template Line Chart 2
RJ0200046_24
- Last Update 04/11/2025
- File Size 0.3MB
- # of Slides 2
- File Format PPTX
- Slide Ratio 16:9
- Color
Keywords
- #Content-Based Slides
- #Design-Based Slides
- #Market and Competitor Analysis
- #Marketing Plan and Strategy
- #Graph
- #Market Analysis
- #Marketing Objectives
- #Line
- #Line Chart
- #16:9
- #line chart PowerPoint slide
- #trend analysis presentation template
- #market analysis chart
- #data visualization PPT
- #competitive comparison graph
About the Product
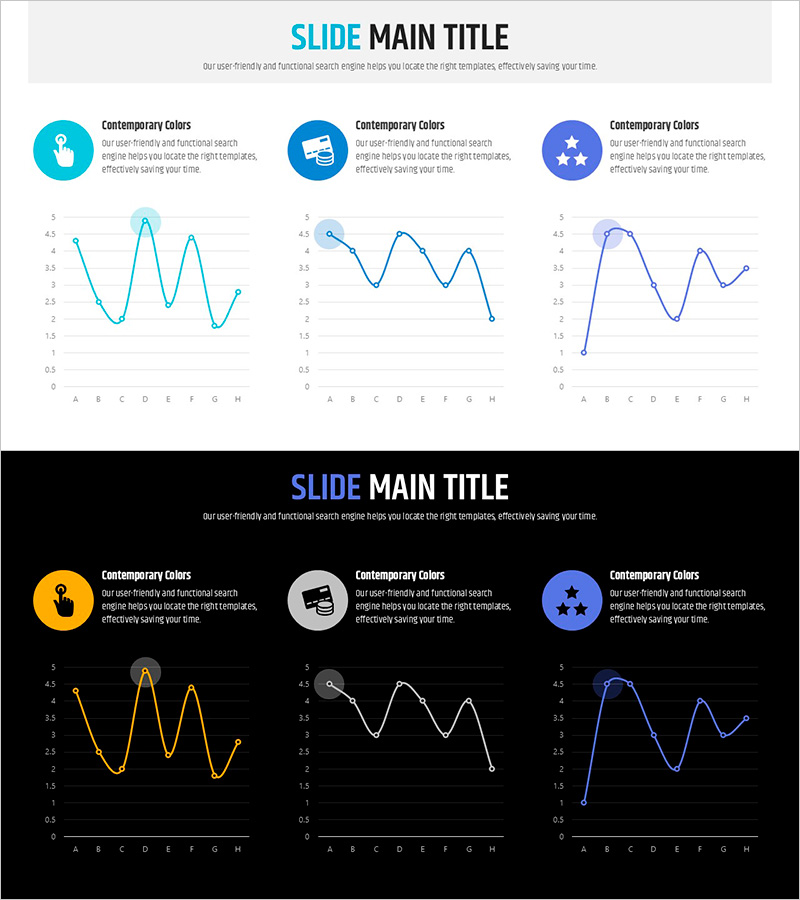
A line chart PowerPoint slide optimized for market analysis and competitive comparison. Two design variations are provided: light background and dark background layouts. Each slide features three independent line charts with cyan, blue, and purple series representing multiple data trends. With 8 data points per chart, you can clearly visualize changes over time and compare performance metrics. This presentation template is ready to use for marketing plans, business reports, quarterly performance reviews, and competitive analysis presentations.
Usage Points
-
Main Usage
Designed to clearly display data trends over time and compare multiple metrics simultaneously. Ideal for visualizing market dynamics, competitor performance, sales trends, and other time-series data in professional presentations.
-
How to Use
Use in the market analysis section of marketing plans, performance analysis pages in quarterly or annual business reports, and trend comparison charts in executive presentations. Light background suits printed materials; dark background works best for digital presentations.
-
Recommended For
Marketing professionals, business analysts, planners, and executives preparing data-driven decision materials. Recommended for quarterly performance reviews, market research presentations, competitive analysis reports, and investor relations materials.
-
Slide Structure
2-slide set with 3 independent line charts per slide. Each chart contains 8 data points (A–H) displayed across cyan, blue, and purple series. Multiple indicators can be compared simultaneously with clear visual distinction between data trends.
Related Products
-

Customer Analytics Bell Diagram – Competitive Advantage Analysis
#Market and Competitor Analysis #Graph #Market Analysis
-

Architectural Illustration Templates and Line Charts – Visualizing Market and Competitive Advantage
#Market and Competitor Analysis #Graph #Market Analysis
-

Pig Family and Market Analysis Graph Slide
#Market and Competitor Analysis #Graph #Market Analysis
-

Line Graph and Key Messages – Market Outlook Analysis
#Market and Competitor Analysis #Graph #Future Outlook
