School Icons and Line Charts – Presentation for Market Analysis
RJ0500029_24
- Last Update 06/15/2025
- File Size 0.3MB
- # of Slides 2
- File Format PPTX
- Slide Ratio 16:9
- Color
Keywords
About the Product
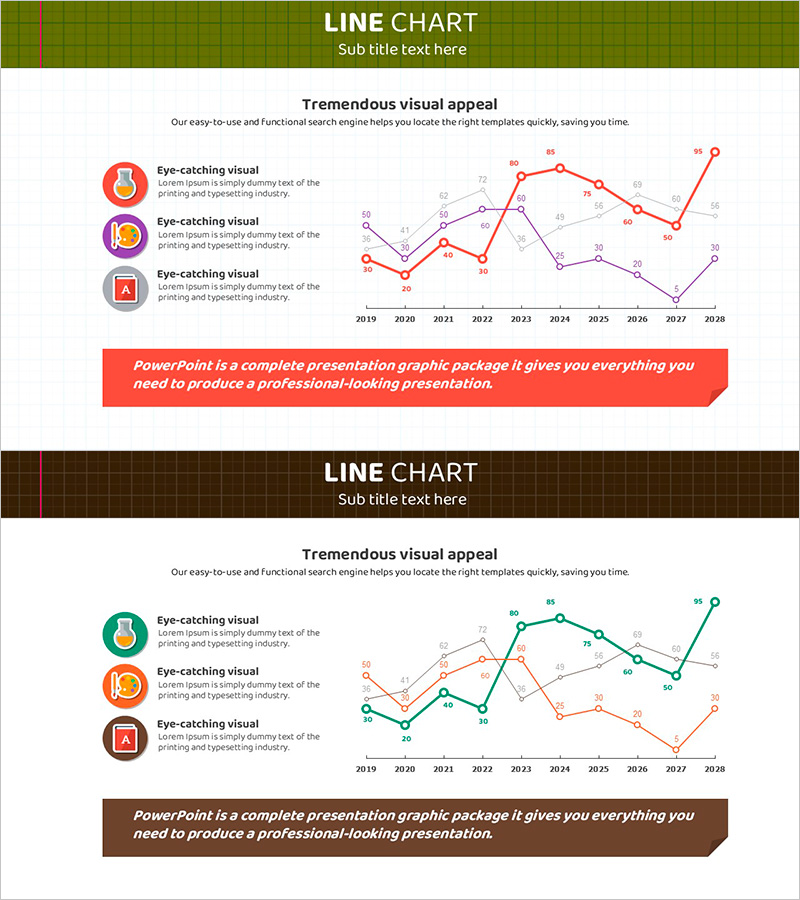
A PowerPoint slide template featuring a multi-series line chart tracking market changes from 2019 to 2028 with three distinct data lines in red, purple, and green. Three school icons positioned on the left side visually represent each data series, while a grid-patterned header in olive or brown provides professional contrast. The clean layout effectively communicates business data such as market analysis, sales trends, and performance comparisons. The 2-slide set is fully editable in 16:9 widescreen PPTX format, ready for immediate customization and presentation.
Usage Points
-
Main Usage
Designed to visualize temporal changes across multiple data series simultaneously, such as market evolution, sales performance, and key performance indicators. The color-differentiated lines enable competitive benchmarking, departmental performance analysis, and year-over-year growth rate visualization in a single, cohesive chart.
-
How to Use
Replace the left-side school icons and accompanying text with your data series labels. Update chart data points and numerical values to reflect your actual statistics. Adjust line colors to match corporate branding guidelines, and customize header text and subtitles to align with your presentation topic.
-
Recommended For
Ideal for executive reports, quarterly earnings presentations, market research findings, investor pitch decks, and marketing performance analysis. Particularly suited for finance, consulting, marketing, and sales teams presenting data-driven insights and strategic decisions.
-
Slide Structure
Comprises a header section with grid-patterned background in olive or brown, title area, left icon panel with three school icons and descriptive labels, right chart area with three-line graph including data points and legend, and a bottom emphasis banner for key messages.
Related Products
-

Curved Charts for Products – Visualizing Market Conditions with Diagrams
#Market and Competitor Analysis #Graph #Market Status
-

Commuting Public Transportation Status Graph – Market Analysis and Outlook
#Market and Competitor Analysis #Graph #Future Outlook
-

Snow Mountain Theme Broken Line Graph – Suitable for Market and Competitive Analysis
#Market and Competitor Analysis #Graph #Competitor Analysis
-

Line Charts for Living Conditions – Visualizing Market Analysis
#Market and Competitor Analysis #Diagram #Graph
