Note Line Graph for Market and Competitor Analysis
RJ0500015_5
- Last Update 06/11/2025
- File Size 3.8MB
- # of Slides 2
- File Format PPTX
- Slide Ratio 16:9
- Color
Keywords
About the Product
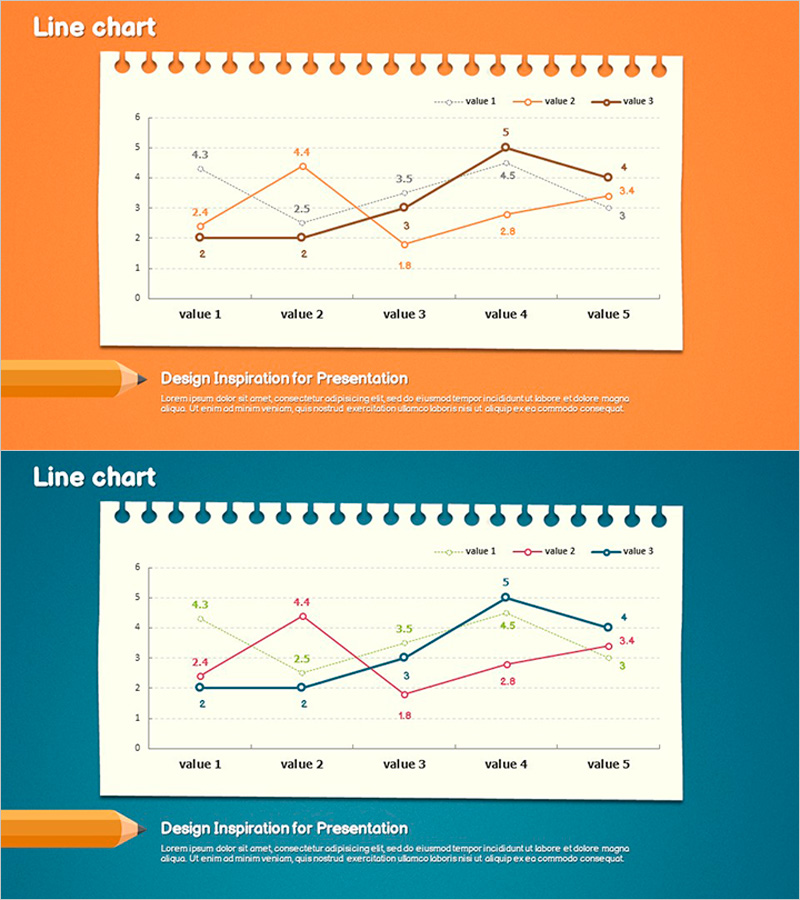
A 3-series line chart PowerPoint slide designed for market and competitor analysis presentations. Three data series in orange, pink, and black colors track changes across five data points, with numeric labels at each node for precise comparison. The 16:9 widescreen format includes 2 slides ready for immediate use in business presentations, reports, and strategic proposals. All elements—colors, axes, legends, and data values—are fully editable to adapt to your specific business metrics and analytical needs.
Usage Points
-
Main Usage
Compares three data series across five time periods or categories to visualize market trends, competitor performance, revenue growth, or customer satisfaction metrics simultaneously. The multi-line format enables stakeholders to identify patterns, divergences, and performance gaps at a glance for informed decision-making.
-
How to Use
Insert into the market analysis, competitive landscape, or performance review sections of your presentation. Replace axis labels, legend text, and numeric values with your actual data. Customize line colors, add or remove series, and adjust the chart range as needed to match your analytical framework.
-
Recommended For
Marketing and sales teams presenting market research, executive management reports, investor pitch decks, business plan competitive analysis sections, quarterly and annual performance reviews, and strategic planning presentations requiring multi-variable trend comparison.
-
Slide Structure
2-slide set with orange header banner and white chart area. Three line series (dotted, orange solid, black solid) connect five data points labeled value 1 through value 5. Numeric data labels appear at each node. Legend positioned on the right identifies each series. Fully customizable axes and title area.
Related Products
-

Medical Experimental Research Data Analysis Slide – Market and Competitor Analysis
#Market and Competitor Analysis #Graph #Competitor Analysis
-

Competitor Analysis Graph for Market Capture
#Market and Competitor Analysis #Graph #Competitor Analysis
-

Graph Showing Trend of Confirmed COVID-19 Cases – Market Analysis
#Market and Competitor Analysis #Graph #Competitor Analysis
-

Data Analysis Graph Visualization for Market Competition
#Market and Competitor Analysis #Diagram #Graph
