Newspaper Wide PowerPoint Template Table for Financial Planning
RJ0200046_18
- Last Update 04/11/2025
- File Size 0.3MB
- # of Slides 2
- File Format PPTX
- Slide Ratio 16:9
- Color
Keywords
- #Content-Based Slides
- #Design-Based Slides
- #Financial Plans and Performance
- #Diagram
- #Sales and Revenue
- #Key Financial Indicators
- #Table
- #Standard Table
- #16:9
- #newspaper wide table PowerPoint
- #financial data comparison slide
- #two-column table template
- #data analysis PowerPoint slide
- #financial planning presentation template
About the Product
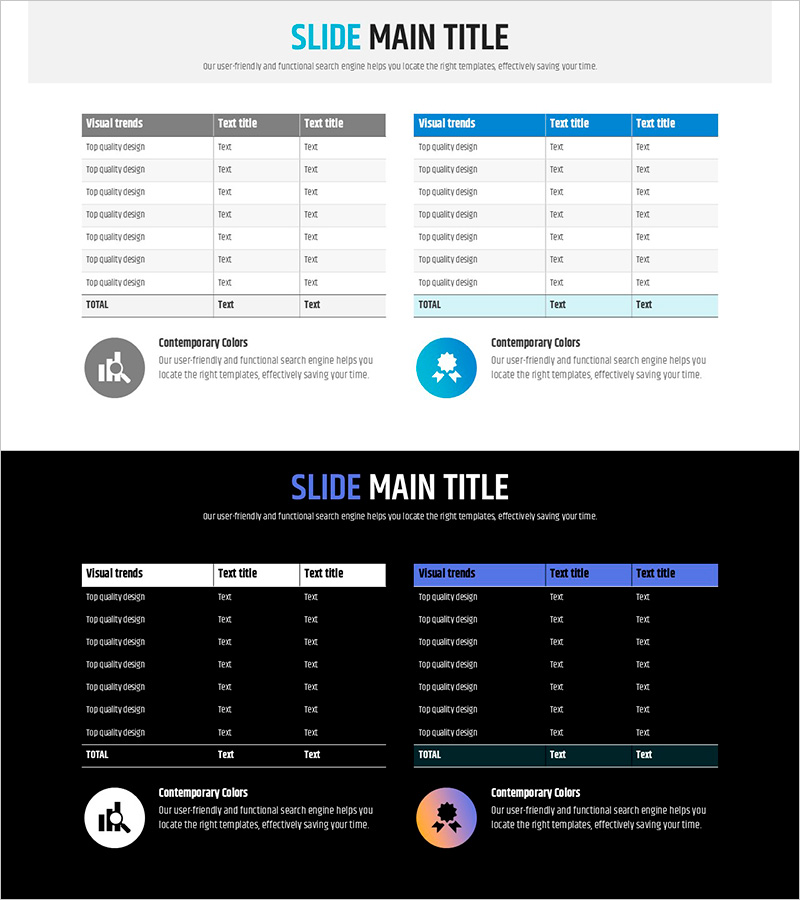
A newspaper-style wide table PowerPoint slide designed for financial planning and data analysis presentations. The two-column layout enables clear side-by-side comparison of numerical data, with gray and blue header rows providing visual distinction and improved readability. Each cell accommodates text and numerical input, making it ideal for financial reports, business plans, quarterly performance reviews, and comparative analysis presentations. Delivered as a 2-slide set in 16:9 widescreen format, ready for immediate customization and use.
Usage Points
-
Main Usage
Present financial metrics, business performance, and quarterly results using a two-column table structure for side-by-side comparison. The newspaper-style wide layout allows simultaneous display of multiple data points, enhancing clarity in comparative analysis and decision-making.
-
How to Use
Enter category names in the header rows and corresponding data in the cells below. The gray header designates the left table while the blue header designates the right table, creating clear visual separation between two data groups. Adjust cell background colors and text formatting to highlight key metrics and improve visual emphasis.
-
Recommended For
Finance teams, executives, and business managers presenting quarterly results, budget vs. actual comparisons, departmental performance, and year-over-year trends. Suitable for financial reports, business plans, investor presentations, and performance review meetings requiring data-driven decision support.
-
Slide Structure
2-slide set. Each slide features a title area at the top and a dual-table section below. Left table with gray header (3 columns, 7 data rows), right table with blue header (3 columns, 7 data rows). Total of 14 cells organized in a comparative analysis structure for flexible data input.
Related Products
-

Grain Yield Table – Financial Planning and Performance
#Financial Plans and Performance #Diagram #Sales and Revenue
-

Visualizing Key Financial Indicators with Diagram Presentation
#Financial Plans and Performance #Diagram #Sales and Revenue
-

Sales and Profit Analysis Table – Essential Tool for Presentation
#Financial Plans and Performance #Diagram #Other
-

Cost Table by Beans – Unique Financial Analysis
#Financial Plans and Performance #Diagram #Sales and Revenue
