Blue Green Climbing Table Chart – Visualization of Financial Performance
RJ0600090_13
- Last Update 07/14/2025
- File Size 1.7MB
- # of Slides 2
- File Format PPTX
- Slide Ratio 16:9
- Color
Keywords
- #Content-Based Slides
- #Design-Based Slides
- #Financial Plans and Performance
- #Diagram
- #Sales and Revenue
- #Key Financial Indicators
- #Table
- #Standard Table
- #16:9
- #table chart PowerPoint
- #climbing table slide template
- #financial performance visualization
- #revenue comparison PPT
- #data table design
- #PowerPoint table slide download
About the Product
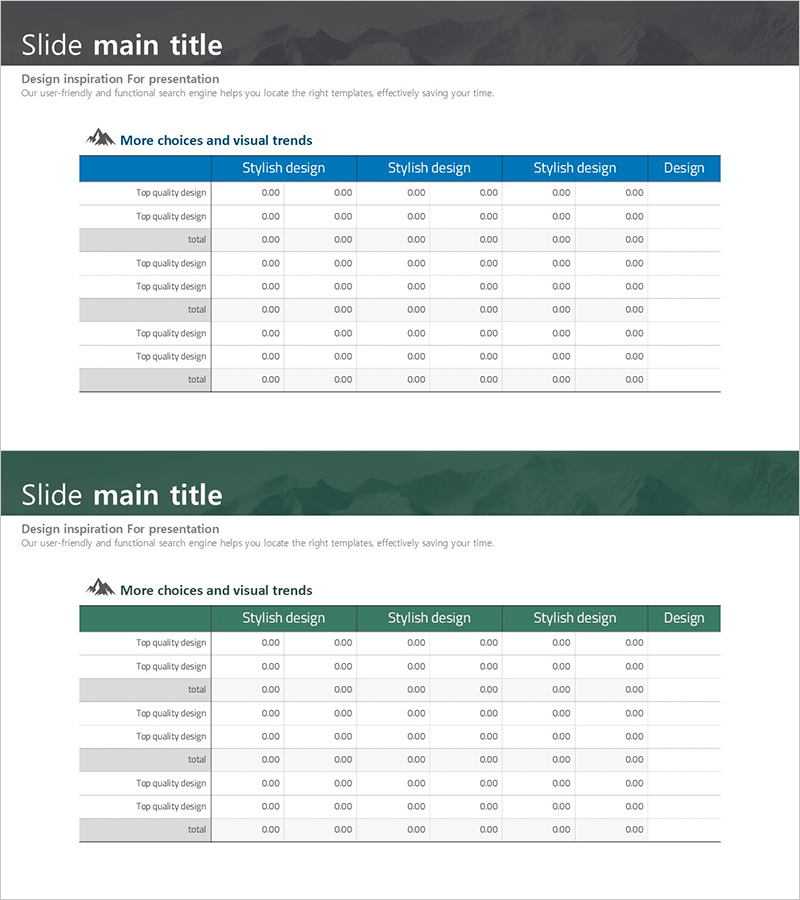
A climbing table chart PowerPoint slide designed to visualize financial performance and revenue trends with ascending step-style structure. This 2-slide PPTX template features blue and green color schemes that emphasize upward momentum through stacked row layout. Each row accommodates 'Top quality design' labels and numerical data entries, with a total row for cumulative performance display. Ideal for quarterly reports, investor presentations, and business performance reviews where growth rates, departmental revenue comparisons, and ROI need clear visual communication in your presentation deck.
Usage Points
-
Main Usage
Serves as a data visualization tool for financial reports, business performance presentations, and quarterly or annual revenue comparisons where upward trends and cumulative achievements need emphasis. The editable data entry fields in each row enable real-time updates, while the total row provides at-a-glance overview of overall performance metrics.
-
How to Use
Open the slide and replace 'Top quality design' text in each row with department names or metric labels. Enter actual numerical data in the right-side columns (0.00 format). Maintain the blue-green color scheme or customize to match your corporate brand colors. Use both slides to display multiple data sets side by side for comparison.
-
Recommended For
Finance teams, executives, and sales departments preparing quarterly reports, investor briefings, and business plan presentations. Particularly effective for highlighting growth rates, profitability, market share, and other upward-trending metrics. Recommended for consulting, financial services, manufacturing, and data-driven organizations requiring professional performance visualization.
-
Slide Structure
2-slide composition with 5-row structure per slide: header row (blue-green background), 3 data rows, and total row. Left column for item labels, right side with 6 numerical input fields (0.00 format). Row spacing and color contrast optimize data readability and visual hierarchy.
Related Products
-

Grain Yield Table – Financial Planning and Performance
#Financial Plans and Performance #Diagram #Sales and Revenue
-

Line PPT Table (Green & Orange) – Visualizing Financial Performance Data
#Financial Plans and Performance #Diagram #Sales and Revenue
-

Sales and Profit Table – Statistical Financial Performance
#Financial Plans and Performance #Diagram #Sales and Revenue
-

Colors Theme Presentation Template Table – Financial Planning and Performance
#Financial Plans and Performance #Diagram #Sales and Revenue
