Visualize Coffee Sales Status with Donut Chart – Market Analysis
RJ0900016_22
- Last Update 08/20/2025
- File Size 0MB
- # of Slides 2
- File Format PPTX
- Slide Ratio 16:9
- Color
Keywords
- #Content-Based Slides
- #Design-Based Slides
- #Market and Competitor Analysis
- #Financial Plans and Performance
- #Graph
- #Market Status
- #Sales and Revenue
- #Circles
- #Doughnut Chart
- #16:9
- #donut chart PowerPoint slide
- #pie chart presentation template
- #sales ratio visualization
- #market share PPT
- #how to create donut chart in PowerPoint
About the Product
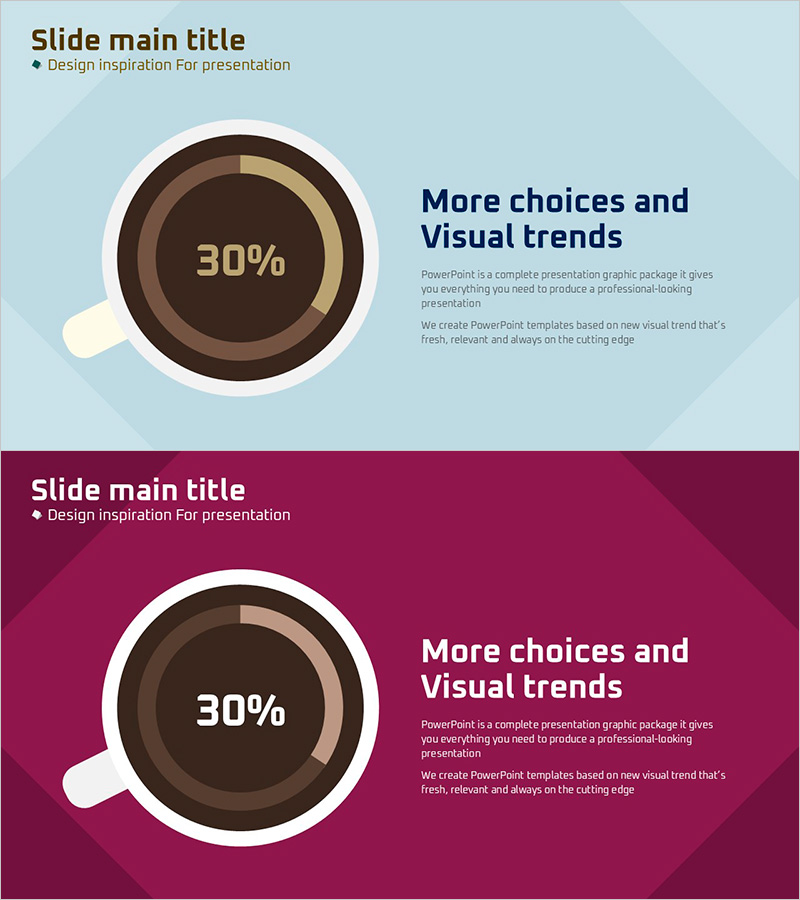
A 2-slide PowerPoint set featuring donut charts to visualize sales performance and market analysis data with clarity and impact. The slides combine light blue and burgundy backgrounds with brown and beige-toned multi-layer donut graphs, emphasizing percentage values at the center. Ideal for presenting sales ratios, market share, and category-wise composition comparisons in professional presentations. Fully editable in PPTX format, allowing you to customize colors, data values, and text to fit various business contexts including financial reports, marketing strategies, and investment pitches.
Usage Points
-
Main Usage
Clearly present sales ratios, market share percentages, and category composition comparisons using multi-layer donut structures with central percentage emphasis. The light blue and brown color scheme conveys professionalism, making it ideal for market analysis and financial performance presentations.
-
How to Use
Apply to financial reports' revenue breakdown sections, marketing plans' market analysis pages, and business proposals' sales strategy segments. The 2-slide set provides light blue and burgundy background variants, perfect for comparative analysis or sequential presentations requiring visual consistency.
-
Recommended For
Finance professionals, marketing strategists, sales managers, and consultants who need to communicate data-driven insights. Effective for quarterly earnings reports, new business proposals, investor pitches, and performance reviews where quantitative results must be highlighted.
-
Slide Structure
Each slide features a multi-layer donut chart on the left (supporting 3-4 data series) with title and descriptive text on the right. The donut center displays key percentages (e.g., 30%), with fully editable data values, labels, and legend elements for flexible customization.
Related Products
-

Donut Chart Slide for Interior Demand Survey
#Market and Competitor Analysis #Financial Plans and Performance #Graph
-

Potted Doughnut Chart for Market Analysis – Performance vs Sales
#Market and Competitor Analysis #Financial Plans and Performance #Graph
-

Building Analysis Chart – Visualizing Market Status and Performance
#Market and Competitor Analysis #Financial Plans and Performance #Graph
-

Newspaper Wide PowerPoint Template Line Chart - Market Analysis and Revenue Performance
#Market and Competitor Analysis #Financial Plans and Performance #Graph
