Donut Chart Slide for Interior Demand Survey
RJ0900023_6
- Last Update 08/23/2025
- File Size 0.3MB
- # of Slides 2
- File Format PPTX
- Slide Ratio 16:9
- Color
Keywords
- #Content-Based Slides
- #Design-Based Slides
- #Market and Competitor Analysis
- #Financial Plans and Performance
- #Graph
- #Market Status
- #Sales and Revenue
- #Circles
- #Doughnut Chart
- #16:9
- #donut chart PowerPoint
- #pie chart slide template
- #market analysis presentation
- #data proportion visualization
- #interior market survey
About the Product
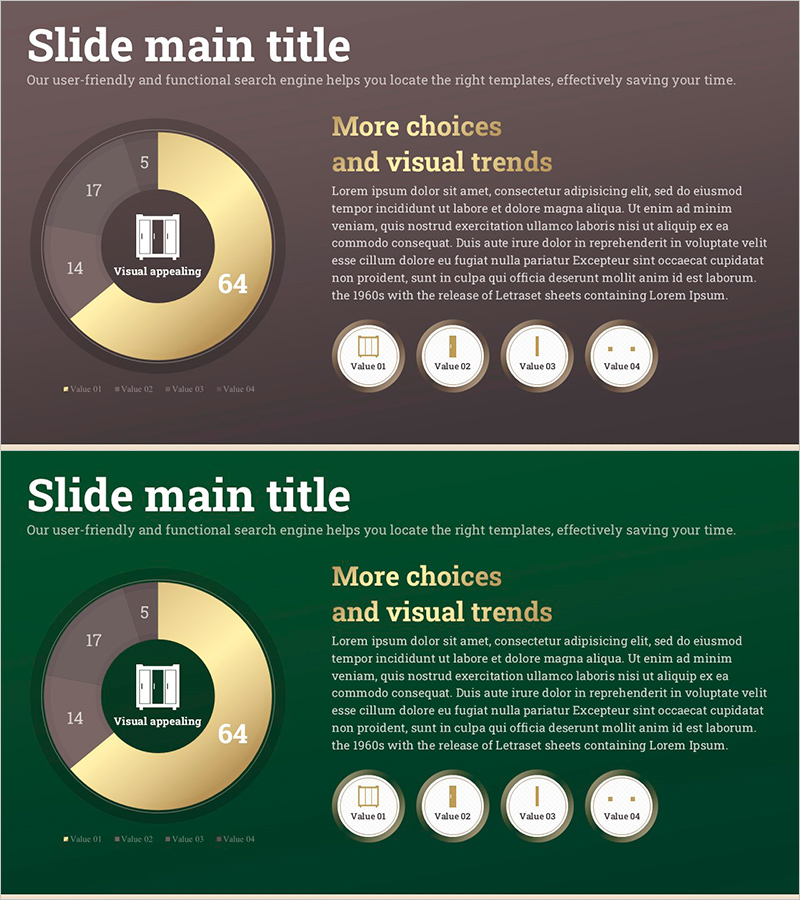
A professional donut chart PowerPoint slide designed for interior demand surveys and market analysis presentations. The design features a four-segment donut chart with cream and gray tones that clearly visualize data proportions, while the center icon area emphasizes key messages. This 2-slide set adapts to various presentation contexts, ideal for visualizing critical metrics such as revenue, profit margins, and customer satisfaction. The 16:9 widescreen format ensures compatibility with modern displays, and the fully editable PPTX format allows instant customization for your specific data and branding requirements.
Usage Points
-
Main Usage
Communicate market size, customer preferences, revenue composition, and other key metrics across four segments to executives, investors, and stakeholders. The center icon area highlights core messages and directs audience attention to critical insights.
-
How to Use
Insert into business plans, market analysis reports, and investor pitch decks within the market overview section to establish data-driven credibility. Edit segment colors and values to match actual data, and customize the center icon to align with industry focus and presentation context.
-
Recommended For
Interior design and construction industry marketing managers, market research analysts, business report writers, and investment proposal specialists presenting customer segmentation, revenue breakdown, and market share analysis.
-
Slide Structure
Two-slide set with identical donut chart layouts for flexible data representation. Each segment is independently editable for color, value, and label customization. The center circular area accommodates icons, text, or logos to reinforce key messages and enhance visual impact.
Related Products
-

Building Analysis Chart – Visualizing Market Status and Performance
#Market and Competitor Analysis #Financial Plans and Performance #Graph
-

Potted Doughnut Chart for Market Analysis – Performance vs Sales
#Market and Competitor Analysis #Financial Plans and Performance #Graph
-

Newspaper Wide PowerPoint Template Line Chart - Market Analysis and Revenue Performance
#Market and Competitor Analysis #Financial Plans and Performance #Graph
-

Visualize Coffee Sales Status with Donut Chart – Market Analysis
#Market and Competitor Analysis #Financial Plans and Performance #Graph
