Trend Color Donut Chart Slide Template – Market and Competitive Analysis
RJ0200045_5
- Last Update 04/11/2025
- File Size 1.1MB
- # of Slides 2
- File Format PPTX
- Slide Ratio 16:9
- Color
Keywords
- #Content-Based Slides
- #Design-Based Slides
- #Company Introduction
- #Market and Competitor Analysis
- #Graph
- #Key Achievements
- #Market Share
- #Circles
- #Doughnut Chart
- #16:9
- #donut chart PowerPoint
- #pie chart slide template
- #market analysis presentation
- #data visualization slides
- #donut graph template
- #PowerPoint chart design
- #how to create donut chart in PowerPoint
About the Product
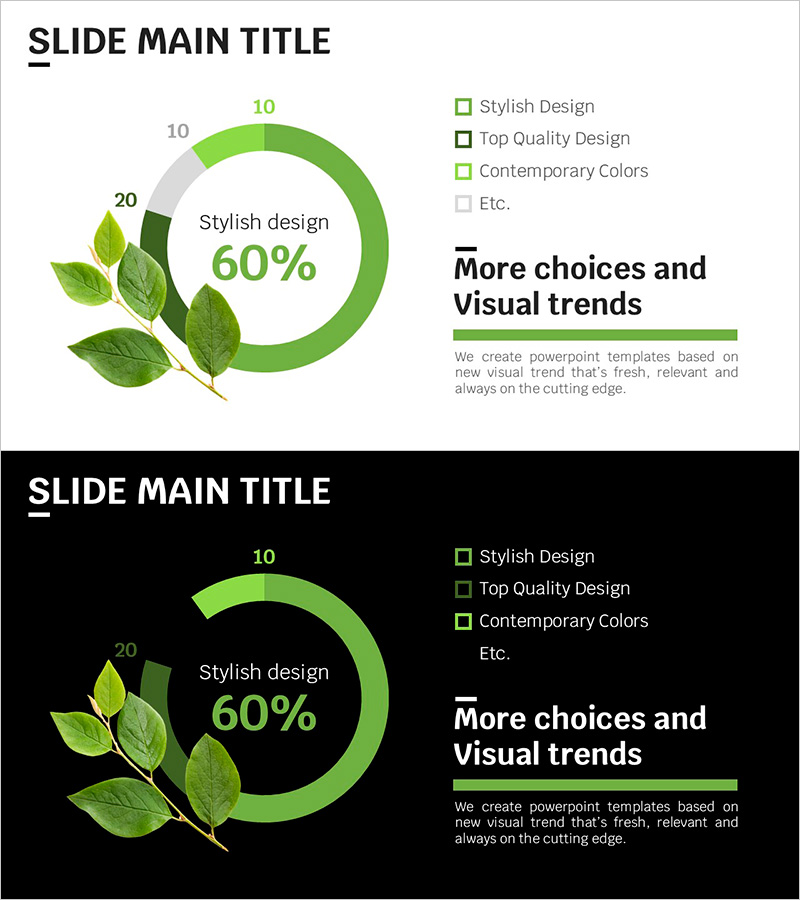
A donut chart PowerPoint slide optimized for market analysis and competitive comparison. The trend color palette—lime green, dark green, and light green—conveys contemporary design sensibility, with the core metric (60%) prominently displayed in the center. Green leaf illustrations symbolize freshness and growth, while the legend clearly presents the proportion of four data segments. The 2-slide set includes both light and dark background versions, allowing you to choose based on your presentation environment. Provided in editable PPTX format, you can input your data and use it immediately without additional design work.
Usage Points
-
Main Usage
Visualizes proportional data such as market share, customer composition, and product sales ratios. The donut center emphasizes key metrics, while the legend clarifies each segment's meaning. Enhances data credibility in executive reports, marketing plans, and business analysis presentations.
-
How to Use
Select the light or dark background slide based on your presentation setting. Replace legend text and values with actual data, then update the center percentage. The distinct color coding ensures clarity in both printed materials and projector environments.
-
Recommended For
Ideal for executives, marketing managers, sales directors, consultants, and analysts presenting market conditions, customer segmentation, and sales performance. Suitable for quarterly reports, investor presentations, internal meetings, and client proposals requiring data-driven insights.
-
Slide Structure
2-slide set featuring the same donut chart on light (white) and dark backgrounds. Each slide includes a center donut (4-segment pie chart), central metric display, right-side legend, and left-side green leaf illustration, optimized for 16:9 widescreen format.
Related Products
-

Rhombus Doughnut Chart PowerPoint Template – Performance and Market Share Analysis
#Company Introduction #Market and Competitor Analysis #Graph
-

Visualization of Traditional Items Proportion – Market Share Analysis
#Company Introduction #Market and Competitor Analysis #Graph
-

Communication Marketing Donut Chart – Performance Visualization
#Company Introduction #Market and Competitor Analysis #Graph
-

Doughnut Chart for Market Share Analysis – Performance and Trends
#Company Introduction #Market and Competitor Analysis #Graph
