Trend Color Wide Template - Segmentation Horizontal Bar Graph
RJ0200045_25
- Last Update 04/11/2025
- File Size 5.5MB
- # of Slides 2
- File Format PPTX
- Slide Ratio 16:9
- Color
Keywords
- #Content-Based Slides
- #Design-Based Slides
- #Company Introduction
- #Market and Competitor Analysis
- #Graph
- #Key Achievements
- #Market Analysis
- #Horizontal Bar
- #Segmented Horizontal Bar
- #16:9
- #segmented horizontal bar chart PowerPoint
- #3-series bar graph slide
- #data comparison template
- #how to create bar chart in PowerPoint
- #market analysis slide template
About the Product
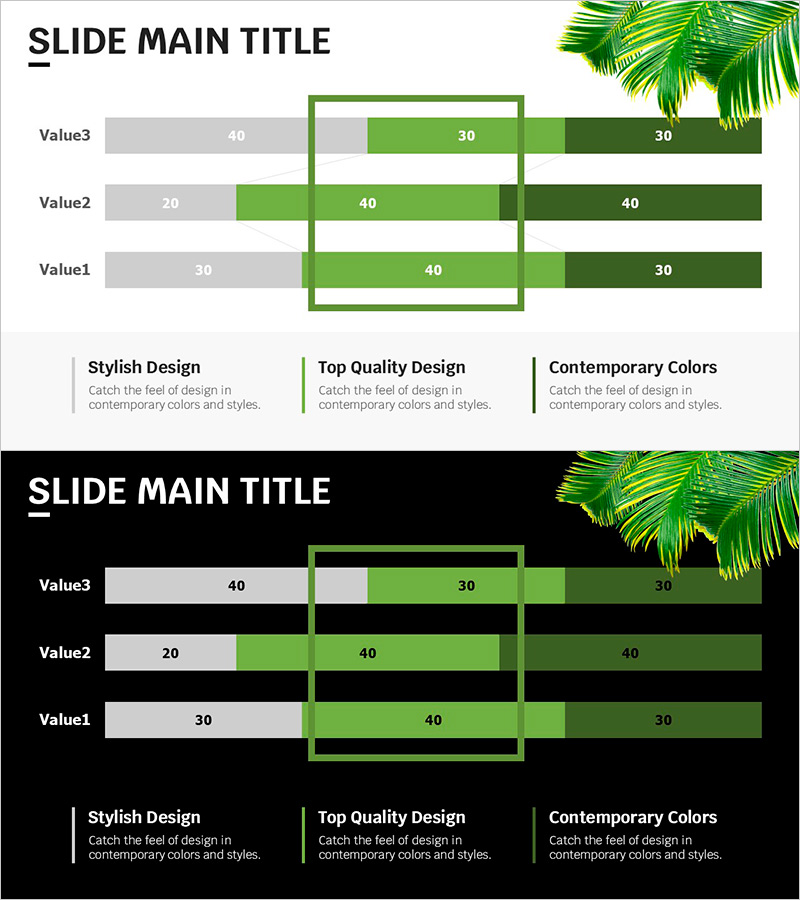
A segmented horizontal bar chart PowerPoint slide designed to compare three data series side by side. Features lime, green, and dark green trend colors that create visual hierarchy and contrast. Each row displays three values simultaneously, making it ideal for comparative analysis in company profiles, market research, and performance reports. The 2-slide set is fully editable and optimized for 16:9 widescreen presentations, allowing instant customization of labels, values, and colors.
Usage Points
-
Main Usage
Effectively compare three or more data points across multiple categories while maintaining visual clarity. Ideal for displaying departmental performance in company overviews, competitive benchmarking in market analysis, quarterly results in performance reports, and budget allocation across divisions.
-
How to Use
Enter category labels in the left column and input corresponding values for each of the three series in the colored bar segments. The bar lengths adjust proportionally to the values entered. Customize colors, labels, and legend text directly in PowerPoint without requiring external tools.
-
Recommended For
Marketing managers, sales directors, financial analysts, business intelligence professionals, and executives presenting data-driven insights. Particularly effective for competitive analysis, performance tracking, resource allocation, and multi-dimensional comparisons.
-
Slide Structure
Three horizontal rows (Value3, Value2, Value1) with three colored bar segments per row: gray (40-30), lime green (30-40), and dark green (30-40). A green border box highlights the central comparison area. Bottom section includes three descriptive text boxes explaining key features: Stylish Design, Top Quality Design, and Contemporary Colors.
Related Products
-

Market Segmentation Analysis Graph – Data-Driven Insights
#Company Introduction #Market and Competitor Analysis #Graph
-

Industry-leading Key Performance Analysis Charts
#Company Introduction #Market and Competitor Analysis #Diagram
-

Bar Graph by Year – Market and Competitor Analysis
#Market and Competitor Analysis #Graph #Competitor Analysis
-

Space Industry Segmentation Bar Graph – Essential for Market Analysis
#Market and Competitor Analysis #Diagram #Graph
