Market Segmentation Analysis Graph – Data-Driven Insights
RM0300018_17
- Last Update 02/11/2025
- File Size 1MB
- # of Slides 2
- File Format PPTX
- Slide Ratio 16:9
- Color
Keywords
- #Content-Based Slides
- #Design-Based Slides
- #Company Introduction
- #Market and Competitor Analysis
- #Graph
- #Key Achievements
- #Market Analysis
- #Horizontal Bar
- #Segmented Horizontal Bar
- #16:9
- #segmented bar chart PowerPoint
- #market analysis slide template
- #data visualization presentation
- #4-item comparison graph
- #horizontal vertical bar chart
About the Product
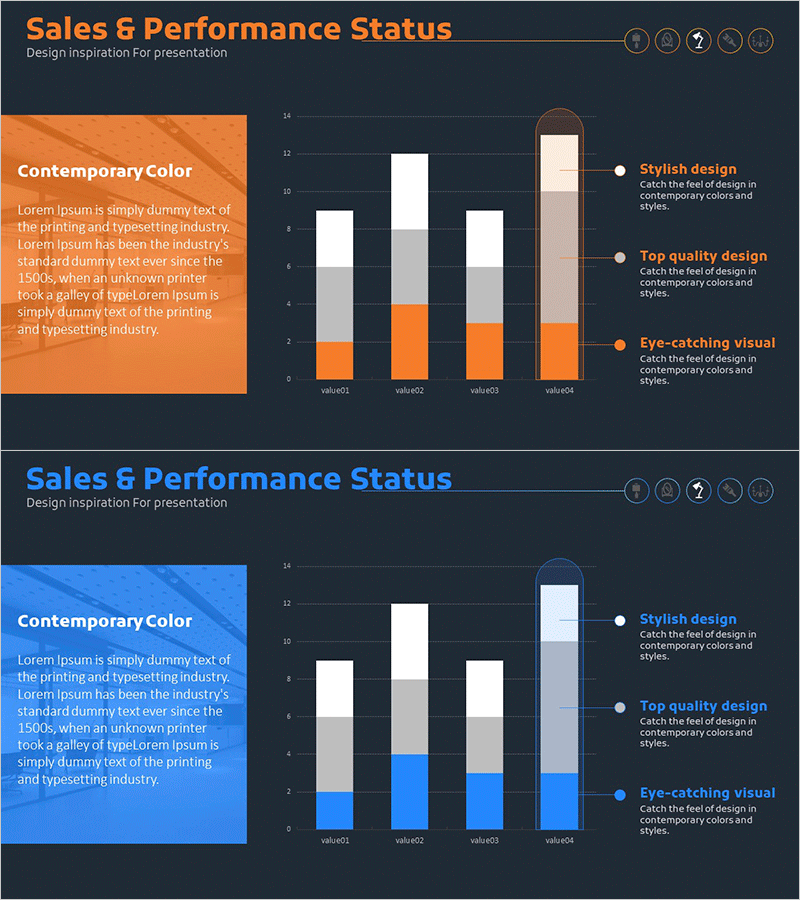
A 2-slide PowerPoint presentation set designed for market segmentation analysis. Features horizontal and vertical bar charts combined on dark navy backgrounds with orange and gray accent colors, enabling simultaneous comparison of four data points and compositional ratios. Clear axis labels and legends are positioned for immediate use in business reports, sales presentations, and marketing analysis decks. Delivered in 16:9 widescreen PPTX format compatible with all presentation environments.
Usage Points
-
Main Usage
Visualizes market segmentation analysis, competitive benchmarking, and sales performance data across multiple categories with clarity. The combined horizontal-vertical bar chart approach simultaneously communicates absolute values and compositional percentages, strengthening decision-making rationale.
-
How to Use
Apply to market analysis sections in business reports, marketing strategy presentations, and quarterly performance reviews. Edit legend and axis labels to match your dataset, then input values for automatic chart updates. High-contrast dark background design ensures excellent readability on large-screen presentations.
-
Recommended For
Marketing managers, business analysts, sales directors, and finance professionals preparing data-driven presentations. Particularly suited for strategic meetings requiring multi-category comparisons, executive briefings, and client-facing presentations.
-
Slide Structure
Two-slide layout: first slide features orange-accented horizontal bar chart (4 series) on dark background; second slide shows gray-accented vertical bar chart (4 series). Each slide includes three-item explanation text area on the right side for parallel delivery of key insights.
Related Products
-

Industry-leading Key Performance Analysis Charts
#Company Introduction #Market and Competitor Analysis #Diagram
-

Trend Color Wide Template - Segmentation Horizontal Bar Graph
#Company Introduction #Market and Competitor Analysis #Graph
-

Segmented Gradient Bar Graph – Optimized for Market Analysis
#Market and Competitor Analysis #Graph #Market Analysis
-

Segmented Bar Graph for Market and Competitor Analysis
#Market and Competitor Analysis #Graph #Competitor Analysis
