Trend Color Wide Template Bar Chart
RJ0200045_19
- Last Update 04/11/2025
- File Size 0.7MB
- # of Slides 2
- File Format PPTX
- Slide Ratio 16:9
- Color
Keywords
About the Product
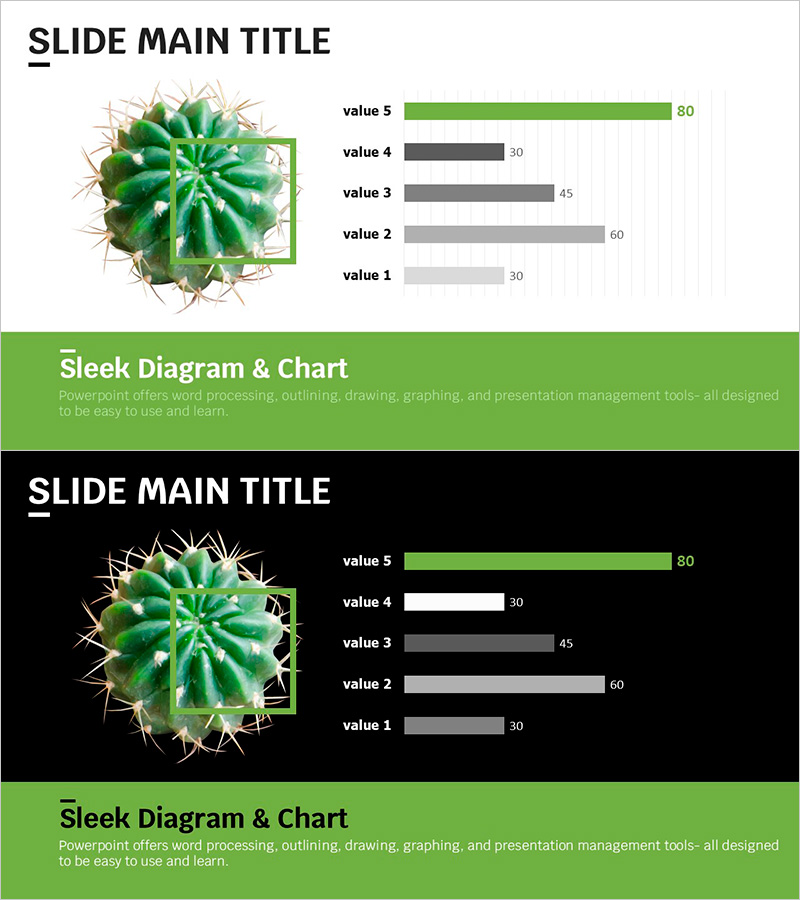
A horizontal bar chart PowerPoint slide designed to visually compare product development progress, sales performance, and key metrics. The design features a vibrant green accent color paired with gray and white supporting colors to clearly highlight data priorities. The 2-slide set includes both light and dark background layouts, allowing you to choose the version that best fits your presentation environment and document style. Each bar displays numerical labels for precise data communication, and the 16:9 widescreen format is optimized for modern presentation settings.
Usage Points
-
Main Usage
Ideal for comparing and analyzing five data points such as product development progress, sales results, performance metrics, and budget allocation. The green accent color draws attention to the highest value, making key data stand out visually and improving audience comprehension.
-
How to Use
Simply replace the bar labels and numerical values with your own data for immediate use. Use the light background slide for printed materials and online presentations, and the dark background slide for in-person meetings in low-light environments. Customize colors and bar lengths to emphasize different data points as needed.
-
Recommended For
Perfect for product development team status reports, sales performance analysis, executive-level results presentations, and marketing campaign outcome reviews. Suitable for any business presentation where quantitative data must be communicated clearly and effectively.
-
Slide Structure
2-slide set: Slide 1 features a light background with 5 horizontal bars (value 1–5), and Slide 2 displays the same structure on a dark background. Each bar is color-coded in gray, white, and green, with numerical labels positioned on the right. A cactus image and geometric frame on the left serve as design accents.
Related Products
-

Vertical Bar Chart for Performance Visualization – Trust and Innovation
#Product/Service Introduction #Market and Competitor Analysis #Diagram
-

Idea Development Status Graph – Clear Data Visualization with Doughnut Chart
#Product/Service Introduction #Market and Competitor Analysis #Graph
-

Website Technology Status Graph – Visualizing Development Status
#Product/Service Introduction #Business Introduction #Graph
-

Chemistry Experiment Progress Graph – Visualizing Market Share
#Product/Service Introduction #Market and Competitor Analysis #Graph
