Website Technology Status Graph – Visualizing Development Status
RJ0400041_14
- Last Update 05/28/2025
- File Size 0.2MB
- # of Slides 2
- File Format PPTX
- Slide Ratio 16:9
- Color
Keywords
- #Content-Based Slides
- #Design-Based Slides
- #Product/Service Introduction
- #Business Introduction
- #Graph
- #Development Status
- #Technological Status
- #Horizontal Bar
- #Horizontal Bar Chart
- #16:9
- #horizontal bar chart PowerPoint
- #bar graph slide template
- #data comparison chart
- #technology status visualization
- #how to create bar chart in PowerPoint
About the Product
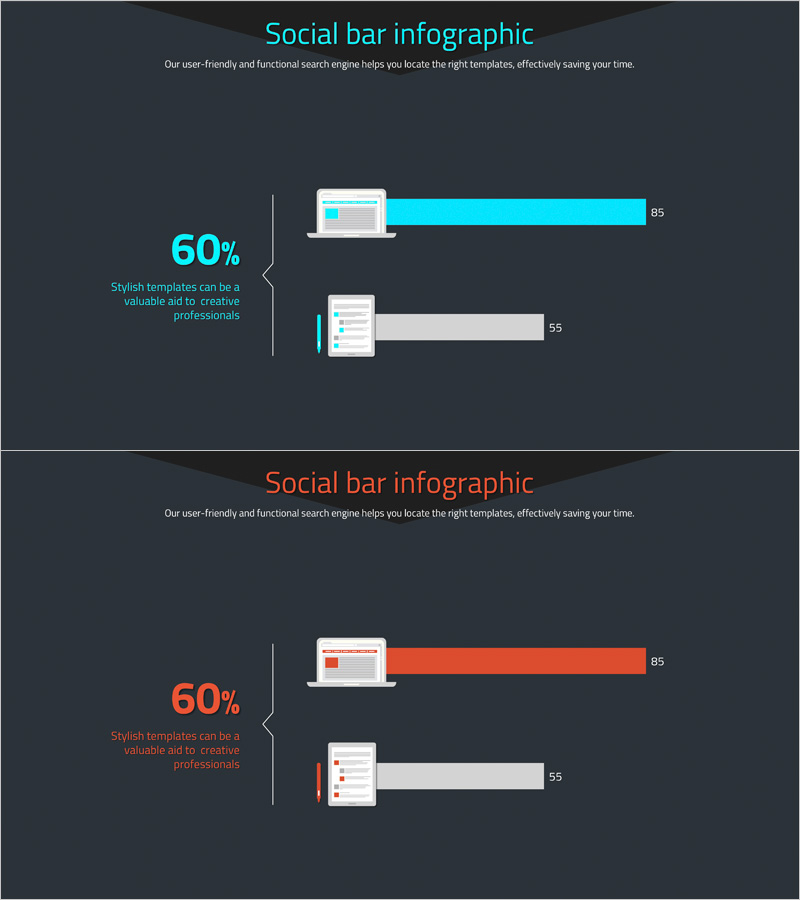
A horizontal bar chart PowerPoint slide that visualizes website technology status and development progress side by side. Featuring a two-tone cyan and gray color scheme, this 2-item comparison chart intuitively represents numerical data with percentage values on the left and proportional bar lengths on the right. Incorporating laptop and checklist mockup icons, it is optimized for technology-related presentations. This ready-to-use slide deck includes 2 slides in 16:9 widescreen format for immediate deployment in your presentations.
Usage Points
-
Main Usage
Designed to compare and visualize numerical data across two metrics such as technology status, development progress rates, or website performance indicators. The combination of percentage values on the left and proportional bar lengths on the right clearly communicates relative size differences, making it ideal for technology reports and project status presentations.
-
How to Use
Use this slide in technology team meetings, development status reports, website performance analysis presentations, and other scenarios requiring simultaneous comparison of two metrics. The laptop and checklist mockup icons reinforce the technology context, while the contrast between cyan accent bars and gray background bars emphasizes key figures.
-
Recommended For
IT departments, development teams, web operations teams, technology managers, and project managers presenting technology status or development progress to executives or clients. Suitable for technology seminars, internal meetings, and client presentations that require data-driven decision support.
-
Slide Structure
Comprises 2 slides with identical layout featuring 2-item horizontal bar charts. Each slide includes a title and descriptive text at the top, a 60% percentage value with explanation on the left, laptop or checklist mockup in the center, and cyan (or orange) accent bars with gray background bars on the right.
Related Products
-

Manufacturing Donut Circle Chart – Visual Data Representation
#Product/Service Introduction #Business Introduction #Graph
-

Technology Achievement Donut Chart
#Product/Service Introduction #Business Introduction #Graph
-

Visualizing Business Development Status with Donut Chart Slide
#Product/Service Introduction #Business Introduction #Graph
-

Big Data Development Status Radial Graph – Captivating Visual Appeal
#Product/Service Introduction #Business Introduction #Diagram
