Vertical Bar Chart for Performance Visualization – Trust and Innovation
RJ0700024_20
- Last Update 07/28/2025
- File Size 3.3MB
- # of Slides 2
- File Format PPTX
- Slide Ratio 16:9
- Color
Keywords
- #Content-Based Slides
- #Design-Based Slides
- #Product/Service Introduction
- #Market and Competitor Analysis
- #Diagram
- #Graph
- #Development Status
- #Market Analysis
- #Structure
- #Horizontal Bar
- #Pyramid Chart
- #Horizontal Bar Chart
- #16:9
- #horizontal bar chart PowerPoint
- #bar graph slide template
- #performance visualization presentation
- #data comparison slide
- #how to create bar chart in PowerPoint
About the Product
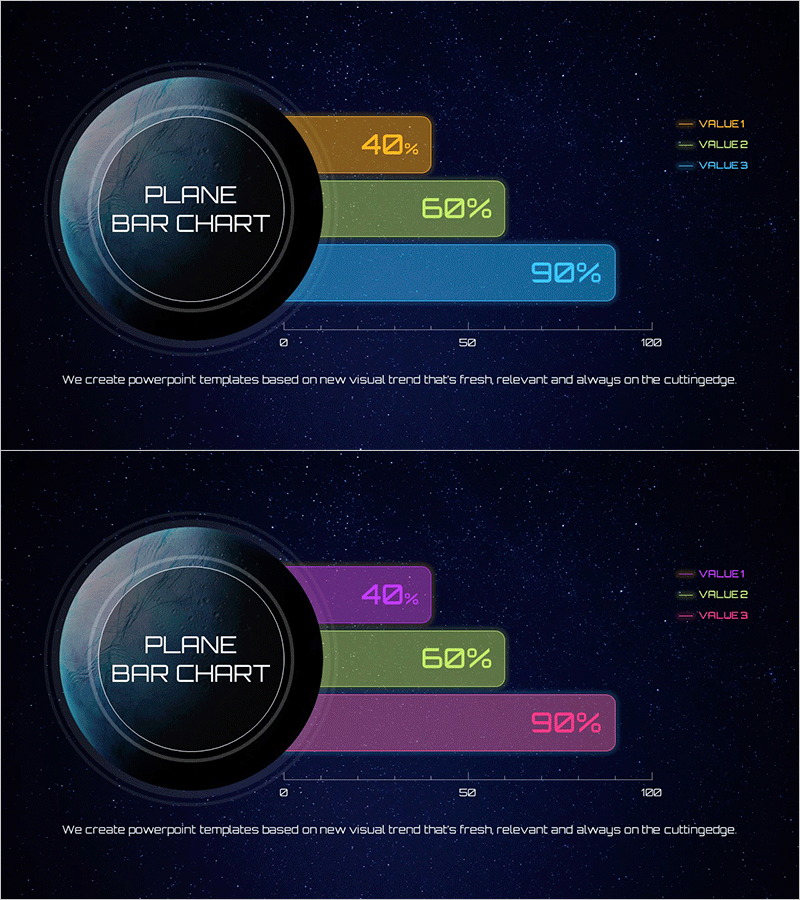
A PowerPoint slide featuring a horizontal bar chart comparing three data items with gold, green, and blue color coding. The central circular frame serves as a visual anchor, while the 0–100% horizontal axis enables standardized ratio representation. Ideal for performance reports, achievement rate analysis, and comparative data presentation. The slide set includes two color variations for flexible design options. All text, values, and labels are fully editable for immediate use in business presentations.
Usage Points
-
Main Usage
Display comparative data across three categories using a horizontal bar format that emphasizes size differences at a glance. The centered circular frame draws visual focus while the 0–100% scale standardizes ratio representation. Perfect for communicating performance metrics, goal achievement, and competitive benchmarking.
-
How to Use
Insert into the performance or results section of executive presentations to show quarterly achievement rates, departmental goal completion, or competitive analysis. Place on key metrics pages to capture audience attention. Replace text and values to adapt the template for different datasets and reporting scenarios.
-
Recommended For
Executive reports, quarterly performance reviews, marketing analytics, sales performance comparisons, project progress tracking, and organizational goal assessment. Recommended for finance teams, sales departments, planning teams, and C-level presentations.
-
Slide Structure
Slide 1: Three-bar horizontal chart in gold, green, and blue (40%, 60%, 90% sample data) with circular frame, legend (VALUE1, VALUE2, VALUE3), and 0–100 scale axis. Slide 2: Same layout with magenta, lime, and pink color scheme for design flexibility.
Related Products
-

Mobile Application Analysis Graph – Data Visualization for Market Understanding
#Market and Competitor Analysis #Graph #Other
-

Bar Chart for Class Evaluation Results – Visual Appeal and Eye-Catching
#Market and Competitor Analysis #Graph #Market Status
-

Diet Preference Graph – A Tool for Market Analysis
#Market and Competitor Analysis #Graph #Market Analysis
-

Cement Theme Bar Graph & Table
#Market and Competitor Analysis #Diagram #Graph
