Competitor Product Analysis and Competitive Advantage Bar Chart – Market Share Comparison
RJ0400021_17
- Last Update 05/23/2025
- File Size 1.6MB
- # of Slides 2
- File Format PPTX
- Slide Ratio 16:9
- Color
Keywords
- #Content-Based Slides
- #Design-Based Slides
- #Market and Competitor Analysis
- #Graph
- #Competitor Analysis
- #Competitive Advantage
- #Horizontal Bar
- #Double Horizontal Bar
- #16:9
- #horizontal bar chart PowerPoint
- #competitor analysis presentation
- #market share comparison slide
- #5-item bar graph
- #competitive advantage chart template
About the Product
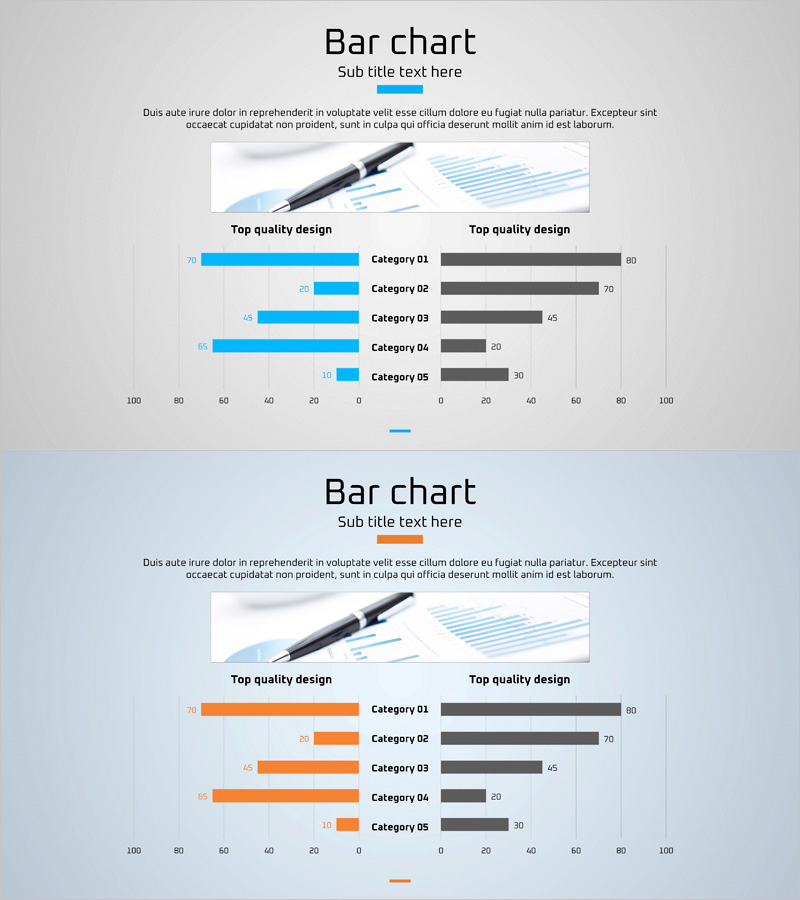
A horizontal bar chart PowerPoint slide designed for competitor product analysis and market share comparison. The design features a contrasting structure with blue bars on the left and gray bars on the right, clearly visualizing competitive advantage across five categories. The dual-axis scale (0-100) enables intuitive representation of relative performance metrics. This presentation template is ready for immediate use in executive reports, strategy meetings, and sales pitches, supporting data-driven decision-making across diverse business scenarios.
Usage Points
-
Main Usage
This slide is optimized for comparing competitor product performance, market share, revenue, and other metrics across five categories, demonstrating your company's competitive advantage through data-backed evidence. The symmetric left-right structure intuitively represents competitive relationships, providing high-credibility data visualization for executive presentations and investor pitches.
-
How to Use
Enter your company data in the blue bars on the left and competitor data in the gray bars on the right to perform category-by-category comparison. Replace category labels (Category 01-05) with actual analysis dimensions such as price, performance, market share, customer satisfaction, or technology capability. Update numerical values and customize colors to match your brand identity.
-
Recommended For
Strategic planning teams, marketing departments, sales teams, and executives responsible for competitive analysis presentations. Ideal for business plans, marketing strategy documents, investor pitch decks, quarterly business reports, and product introduction presentations where competitive advantage must be demonstrated through quantitative evidence.
-
Slide Structure
Two-slide layout with each slide displaying five categories in a symmetric horizontal bar structure. Blue bars (five bars) on the left and gray bars (five bars) on the right are arranged symmetrically around a center zero axis, with numerical labels at each bar end. The 16:9 widescreen format is optimized for projector and monitor environments.
Related Products
-

Horizontal Bar Graph for Cooking Competition
#Market and Competitor Analysis #Graph #Competitor Analysis
-

Horizontal Bar Chart for Beer Competitive Advantage Visualization
#Market and Competitor Analysis #Graph #Competitor Analysis
-

Eco-Friendly Business Goal Market Strategy Horizontal Bar Chart
#Market and Competitor Analysis #Graph #Competitor Analysis
-

Competitor Analysis Bar Graph – Check Market Advantage
#Market and Competitor Analysis #Graph #Competitor Analysis
