Segmented Vertical Bar Graph for Automotive Market Trends
RJ0200044_20
- Last Update 04/10/2025
- File Size 2.8MB
- # of Slides 2
- File Format PPTX
- Slide Ratio 16:9
- Color
Keywords
- #Content-Based Slides
- #Design-Based Slides
- #Market and Competitor Analysis
- #Graph
- #Other
- #Market Share
- #Industry Trends
- #Column
- #Segmented Column
- #Map
- #16:9
- #vertical bar chart PowerPoint
- #segmented bar graph template
- #market trend analysis slide
- #year-over-year comparison chart
- #how to create bar chart in PowerPoint
About the Product
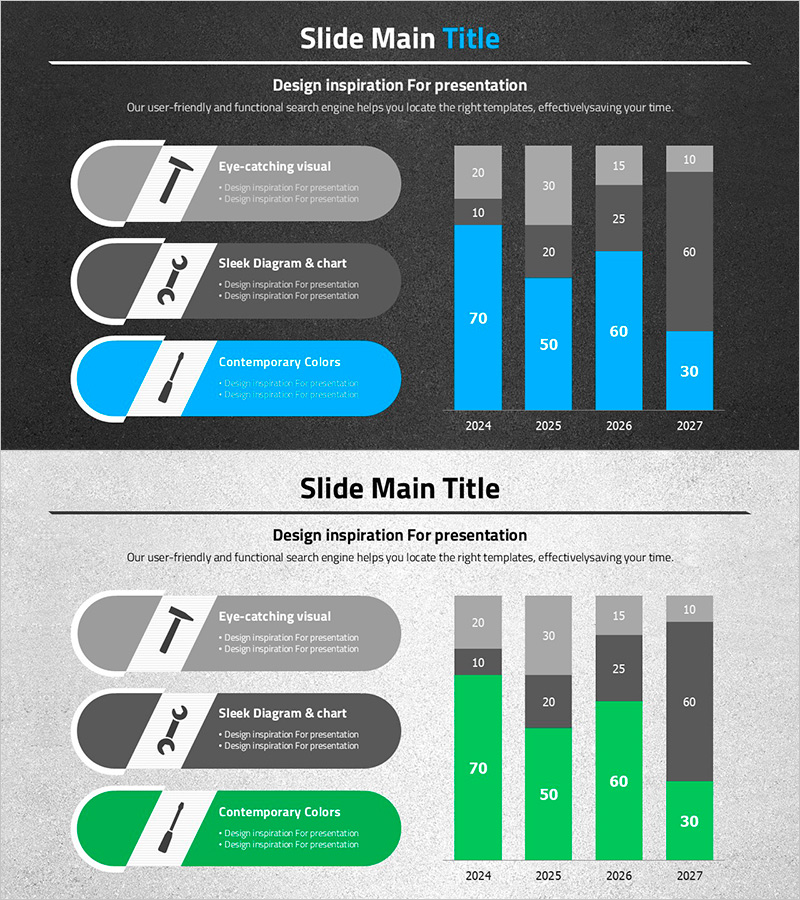
A segmented vertical bar chart PowerPoint slide optimized for automotive market trend analysis. This presentation template visualizes data across four years (2024–2027) with four distinct data series, enabling clear year-over-year and category-by-category comparison. The design features a dark background with blue, orange, and gray bar segments, making it ideal for displaying market share, sales volume, growth rates, and other business metrics. The slide is fully editable—simply input your data and the chart updates automatically. Perfect for business reports, pitch decks, strategic planning presentations, and quarterly performance reviews.
Usage Points
-
Main Usage
Visualize automotive market trends, sales progression, and market share evolution across four years using a segmented vertical bar chart. Enables clear comparative analysis of multiple data series and year-over-year performance metrics.
-
How to Use
Double-click each bar segment to edit the numerical values; the chart updates automatically. Modify year labels (2024–2027) and series names in the legend to adapt the slide for different industries, metrics, or time periods.
-
Recommended For
Automotive manufacturers, dealers, and component suppliers presenting market analysis. Ideal for investment reports, business plans, marketing strategy presentations, quarterly earnings reports, and executive dashboards.
-
Slide Structure
Two-slide set in 16:9 widescreen PPTX format. Slide 1 features a dark background with three feature callouts (Eye-catching visual, Sleek Diagram & chart, Contemporary Colors) alongside the 4-series vertical bar chart. Slide 2 presents the same layout on a light background, providing design flexibility for different presentation contexts.
Related Products
-

Business Trends by Architectural Sector – Change and Growth
#Market and Competitor Analysis #Graph #Market Share
-

Aurora Camping Customer Analysis Chart
#Market and Competitor Analysis #Graph #Market Share
-

Construction Business Trend Graph of Office Buildings – Essential Template for Market Analysis
#Market and Competitor Analysis #Graph #Market Share
-

Country-by-Country Analysis Comparison Chart – Market and Competitor Analysis
#Market and Competitor Analysis #Marketing Plan and Strategy #Graph
