Construction Business Trend Graph of Office Buildings – Essential Template for Market Analysis
RJ0900006_14
- Last Update 08/17/2025
- File Size 0.1MB
- # of Slides 2
- File Format PPTX
- Slide Ratio 16:9
- Color
Keywords
- #Content-Based Slides
- #Design-Based Slides
- #Market and Competitor Analysis
- #Graph
- #Market Share
- #Industry Trends
- #Column
- #Segmented Column
- #16:9
- #vertical bar chart PowerPoint
- #4-year trend comparison slide
- #business trend chart template
- #market analysis graph PowerPoint
- #multi-series bar chart presentation
About the Product
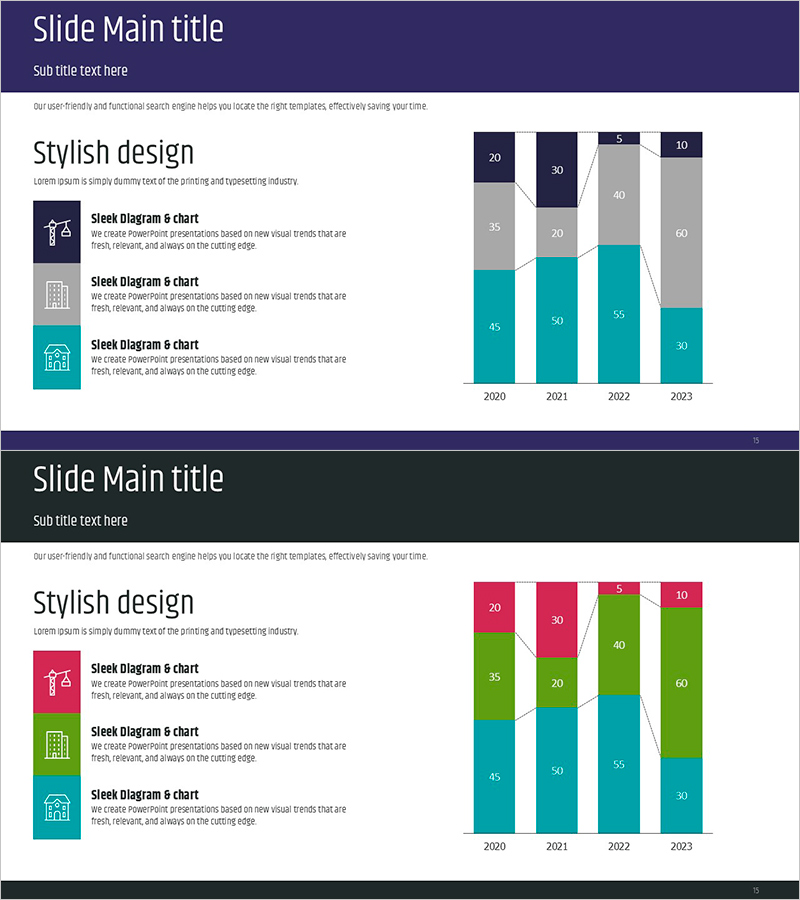
A vertical bar chart PowerPoint slide visualizing office building construction business trends across four years (2020–2023). The slide presents data in four series distinguished by teal, gray, navy, and pink color coding, enabling clear comparison of multiple metrics. This presentation template is ready for immediate use in market analysis and business trend reports, with fully editable structure that auto-updates when you input new values.
Usage Points
-
Main Usage
Comparative data visualization for year-over-year and item-by-item analysis of business metrics. Bar height intuitively represents numerical magnitude, while four-series color differentiation enables simultaneous comparison of multiple data points. Optimized for market analysis and statistical sections in real estate and construction industry reports.
-
How to Use
Insert into the market analysis or business trend section of your report or presentation. Simply input your existing data values and bar lengths adjust automatically—no need to create separate charts. Colors, axis labels, and legend can be customized to match your company branding.
-
Recommended For
Real estate, construction, and architecture professionals preparing business plans, market analysis reports, and investor pitch decks. Finance teams, marketing departments, and executives use this template to support data-driven decision-making in presentations.
-
Slide Structure
Two-slide layout. First slide features a navy and gray background title section. Second slide displays a vertical bar chart with four years (2020–2023) and four data series, totaling 16 data points. Each bar is color-coded in teal, gray, navy, and pink, with Y-axis range set from 0 to 60.
Related Products
-

Aurora Camping Customer Analysis Chart
#Market and Competitor Analysis #Graph #Market Share
-

Business Trends by Architectural Sector – Change and Growth
#Market and Competitor Analysis #Graph #Market Share
-

Segmented Vertical Bar Graph for Automotive Market Trends
#Market and Competitor Analysis #Graph #Other
-

Stacked Chart of Segmented Portfolio Contributions – A Powerful Tool for Business Strategy
#Business Strategy #Market and Competitor Analysis #Graph
