Business Trends by Architectural Sector – Change and Growth
RJ0900004_11
- Last Update 08/16/2025
- File Size 0.4MB
- # of Slides 2
- File Format PPTX
- Slide Ratio 16:9
- Color
Keywords
- #Content-Based Slides
- #Design-Based Slides
- #Market and Competitor Analysis
- #Graph
- #Market Share
- #Industry Trends
- #Column
- #Segmented Column
- #16:9
- #architectural business trends chart
- #vertical bar chart PowerPoint
- #construction market analysis slide
- #year-over-year comparison presentation
- #industry growth visualization
About the Product
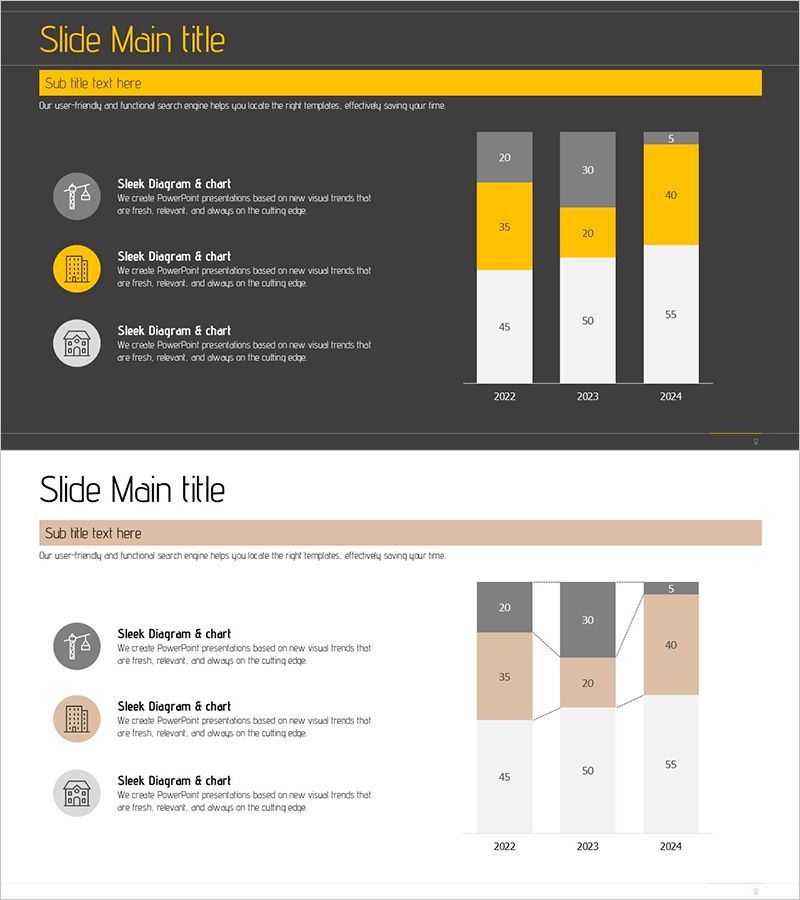
A PowerPoint slide that visualizes business trends across architectural sectors with a vertical bar chart format. The slide displays three years of data from 2022 to 2024, using three color series—gray, white, and yellow—to distinguish different metrics and enable easy year-over-year comparison. This presentation template is ideal for architectural firms and construction companies presenting market analysis, growth trends, and performance metrics. The 2-slide set offers flexible layout options and is fully editable in PPTX format for immediate customization.
Usage Points
-
Main Usage
Effectively visualizes year-over-year business trends and market growth in architectural presentations. The three-series vertical bar chart with gray, white, and yellow color coding clearly represents multiple data metrics simultaneously, making complex industry data accessible and impactful.
-
How to Use
Insert into business plans, investment pitch decks, or quarterly performance reports in the market analysis section to explain architectural industry changes and growth. Edit the numerical values to match your data, and customize titles and legends to align with your presentation context.
-
Recommended For
Architects, construction company executives, real estate developers, construction project managers, financial analysts, and industry consultants preparing market analysis and trend reports.
-
Slide Structure
Two-slide set featuring a dark-background layout with yellow accent box and three icons on the first slide, and a light-background layout with the same vertical bar chart on the second. Each slide displays three years of data (2022, 2023, 2024) across three color-coded series representing different metrics.
Related Products
-

Aurora Camping Customer Analysis Chart
#Market and Competitor Analysis #Graph #Market Share
-

Construction Business Trend Graph of Office Buildings – Essential Template for Market Analysis
#Market and Competitor Analysis #Graph #Market Share
-

Segmented Vertical Bar Graph for Automotive Market Trends
#Market and Competitor Analysis #Graph #Other
-

Market Trends Analysis Chart – Effective for Market and Marketing Strategy
#Market and Competitor Analysis #Marketing Plan and Strategy #Diagram
