Car Wide Template Line Chart – Market and Competitive Analysis
RJ0200044_10
- Last Update 04/10/2025
- File Size 2.9MB
- # of Slides 2
- File Format PPTX
- Slide Ratio 16:9
- Color
Keywords
About the Product
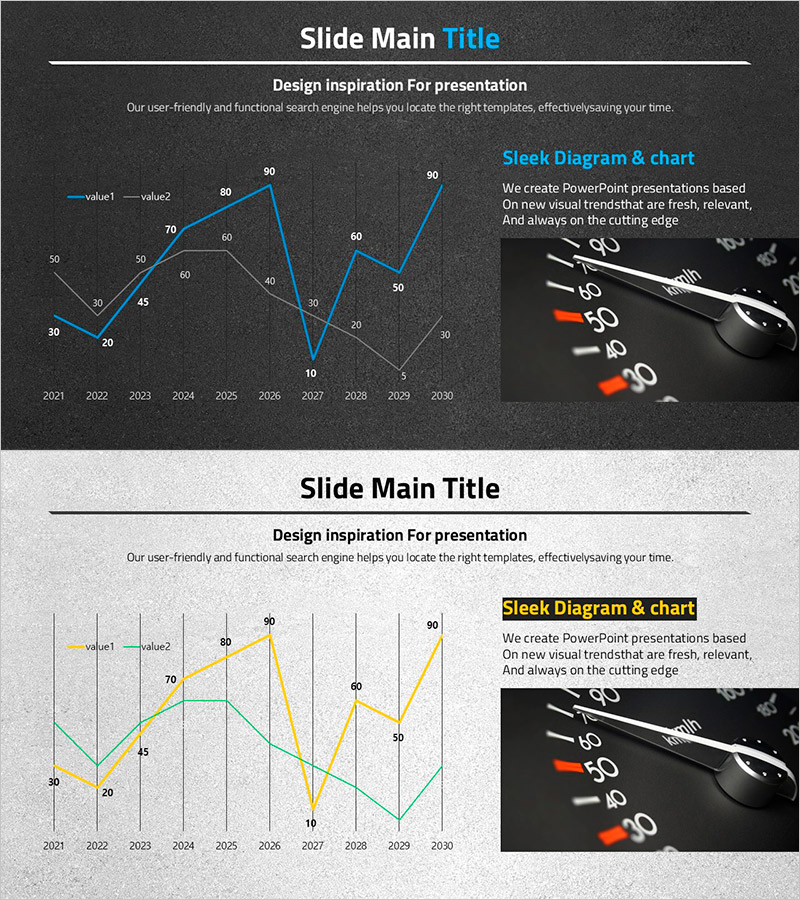
A dual-series line chart PowerPoint slide visualizing market data from 2021 to 2030. Two data series are represented with blue-toned lines on a dark background, with each year's data point clearly labeled. This presentation slide is optimized for quantitative data-driven discussions including market analysis, competitive benchmarking, and business performance trends. Provided in 16:9 widescreen format and fully editable in PPTX format for immediate customization.
Usage Points
-
Main Usage
Clearly visualizes quantitative data changes over time. Compares two independent data series simultaneously to effectively communicate market trends, competitive performance, and business metrics to stakeholders.
-
How to Use
Use in the market analysis section of business plans, quarterly and annual performance reports, competitive analysis materials, and investor pitch decks. Edit data points and line colors to match your figures for immediate deployment in presentations.
-
Recommended For
Marketing managers, business strategists, financial analysts, and sales executives requiring data-driven presentations. Particularly effective for market research, competitive analysis, and explaining business performance trajectories.
-
Slide Structure
Dark background with a coordinate system featuring X-axis (2021–2030 years) and Y-axis (0–90 values). Two blue-toned lines intersect across the chart with numerical values marked at each data point. A legend distinguishes value1 and value2. Title area and descriptive text space are positioned on the right side.
Related Products
-

Eco-friendly Business Future Outlook Line Graph – Market Analysis
#Market and Competitor Analysis #Graph #Future Outlook
-

Comparison Emphasis Line Graph & Explanatory Text – Market Analysis and Competitive Advantage
#Market and Competitor Analysis #Graph #Future Outlook
-

Line Graph Slide Visualizing Ocean Market Trends
#Market and Competitor Analysis #Graph #Market Status
-

Modern Business Plan Line Diagram – Visualizing Market Strategy
#Market and Competitor Analysis #Marketing Plan and Strategy #Graph
