Financial Status Analysis Chart – Business Introduction and Future Insights
RM0500005_7
- Last Update 02/21/2025
- File Size 0.3MB
- # of Slides 2
- File Format PPTX
- Slide Ratio 16:9
- Color
Keywords
- #Content-Based Slides
- #Design-Based Slides
- #Business Introduction
- #Market and Competitor Analysis
- #Diagram
- #Graph
- #Future Outlook
- #Table
- #Column
- #Standard Table
- #Grouped Column
- #16:9
- #grouped bar chart PowerPoint
- #financial status analysis slide
- #multi-series chart template
- #business performance report
- #comparative data visualization PPT
About the Product
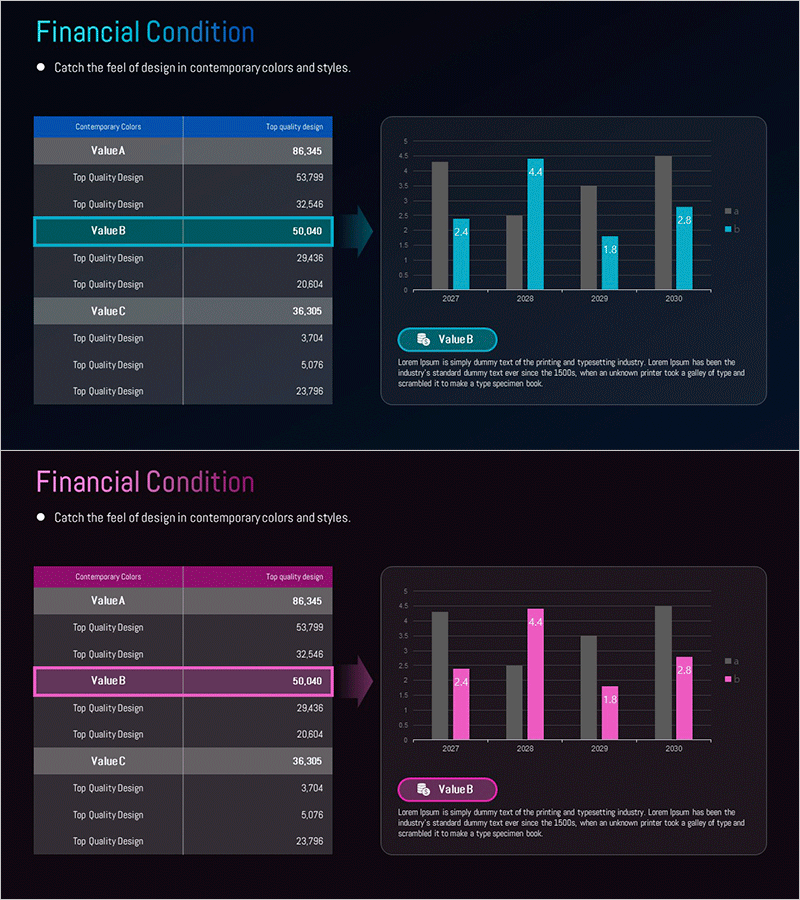
A grouped bar chart PowerPoint slide for analyzing financial status across multiple years and metrics. This presentation template visualizes financial data from 2027 to 2030 using both horizontal and vertical bar combinations, with cyan and gray color schemes to highlight key performance indicators. Ideal for business presentations, financial reports, investor pitches, and strategic planning sessions where comparative analysis of complex datasets is essential. The 16:9 widescreen format includes 2 fully editable slides ready for immediate use.
Usage Points
-
Main Usage
Simultaneously compare multiple financial indicators across several years to clearly visualize business performance trends and future projections. The combination of horizontal and vertical bar formats enables multi-dimensional data interpretation, making it ideal for executive briefings, investor relations presentations, and strategic business planning sessions.
-
How to Use
Slide 1 presents financial data in table format with organized numerical values. Slide 2 displays the grouped bar chart visualization with Value A, B, and C items color-coded for easy comparison across 2027-2030. The cyan accent box highlights the key metric (Value B), and all data points and legends are fully editable to match your specific financial figures.
-
Recommended For
CFOs, finance managers, and business planning teams presenting quarterly or annual financial performance to executives and boards. Also suitable for business plans, investment pitch decks, annual reports, and strategic documents where quantitative data-driven decision-making requires credible visual representation.
-
Slide Structure
Slide 1: Financial data table with 3 value categories (A, B, C) and year-by-year detailed figures. Slide 2: Grouped bar chart spanning 2027-2030 (4 years), with 3 data series per year, cyan-gray-dark tone color differentiation, right-aligned legend, and Value B emphasis callout box.
Related Products
-

Construction Company Debt and Capital Structure Analysis Chart
#Business Introduction #Market and Competitor Analysis #Diagram
-

THE ROAD Presentation Table & Tied Vertical Bar Graph – Market and Competitor Analysis
#Market and Competitor Analysis #Diagram #Graph
-

Graph of Financial Outlook Analysis after Investment Attraction
#Business Introduction #Market and Competitor Analysis #Diagram
-

Cash Flow and Earnings Outlook Chart
#Business Introduction #Market and Competitor Analysis #Graph
