The Curve of Football Development - Market Analysis and Future Outlook
RJ0600037_15
- Last Update 06/30/2025
- File Size 0.5MB
- # of Slides 2
- File Format PPTX
- Slide Ratio 16:9
- Color
Keywords
- #Content-Based Slides
- #Design-Based Slides
- #Technical Approach
- #Market and Competitor Analysis
- #Graph
- #Future Development Roadmap
- #Future Outlook
- #Line
- #Line Chart
- #16:9
- #line chart PowerPoint slide
- #dual-series trend analysis
- #10-year data visualization
- #market analysis chart
- #growth curve presentation template
About the Product
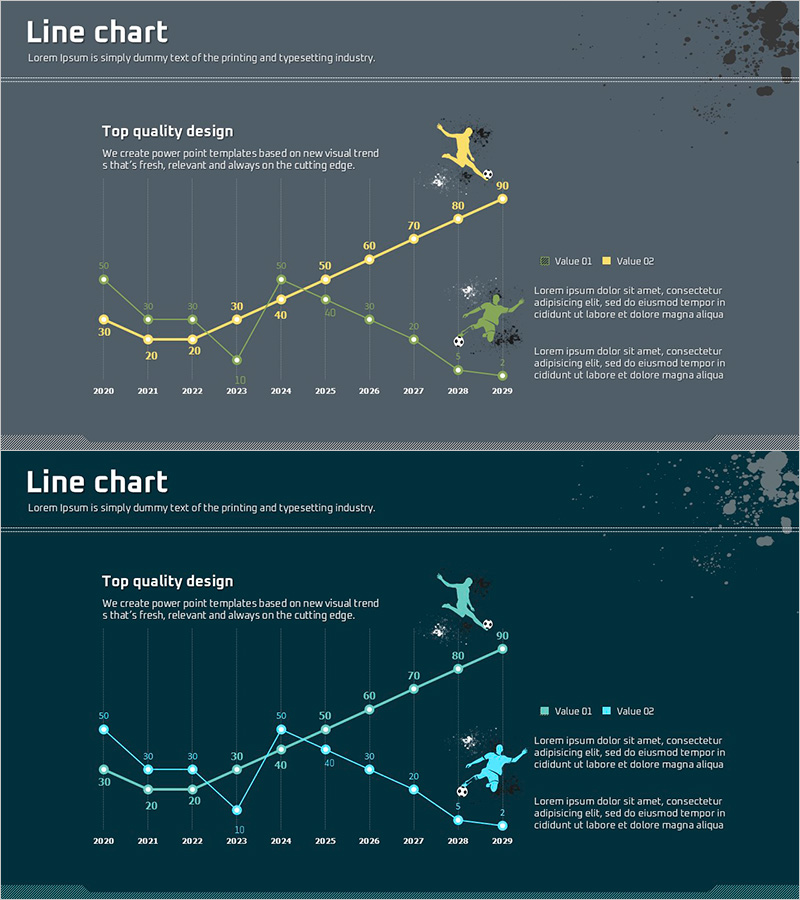
A dual-series line chart PowerPoint slide that tracks data changes across a 10-year period with clear visualization of trends and growth patterns. The minimalist layout features gray and yellow backgrounds with explicitly labeled data points and numerical values, making it ideal for market analysis, performance tracking, and technology development presentations. Two slide variations with different color schemes (gray and teal backgrounds) allow you to choose the design that best matches your presentation tone. Fully editable PPTX format for immediate customization.
Usage Points
-
Main Usage
Clearly visualizes long-term data trends and growth curves by displaying two data series simultaneously. Enables quick comparison of patterns—rising, falling, or fluctuating—making it ideal for business contexts such as market analysis, technology roadmaps, revenue trends, and performance metrics.
-
How to Use
Replace the data points and numerical labels with your actual figures. Update the legend labels (Value 01 and Value 02) with your metric names, adjust the X-axis years and Y-axis values, and the slide is ready for presentation. Choose between the two color-scheme versions based on your presentation's visual tone.
-
Recommended For
Executives, analysts, marketers, and technical leads presenting quarterly or annual performance reports, market trend analysis, technology roadmaps, and investor presentations. Particularly effective when comparing two metrics—such as competitor vs. company performance, historical vs. current data, or target vs. actual results.
-
Slide Structure
Each slide contains a title area, dual-series line chart with 10 data points, legend, and explanatory text section. The chart includes a grid background with node markers and numerical labels; an additional text box for annotations is positioned on the right side.
Related Products
-

Analysis of Sales Growth Segments Slide
#Technical Approach #Market and Competitor Analysis #Diagram
-

Trends Visualized with Line Chart
#Technical Approach #Market and Competitor Analysis #Graph
-

Current Status and Prospects of Construction Business – Insightful Analysis
#Technical Approach #Market and Competitor Analysis #Graph
-

Line Charts in Urban Background – Business Strategy and Market Analysis
#Business Strategy #Market and Competitor Analysis #Graph
