Color Theme Presentation Template for Line Charts
RJ0200043_14
- Last Update 04/10/2025
- File Size 0.8MB
- # of Slides 2
- File Format PPTX
- Slide Ratio 16:9
- Color
Keywords
About the Product
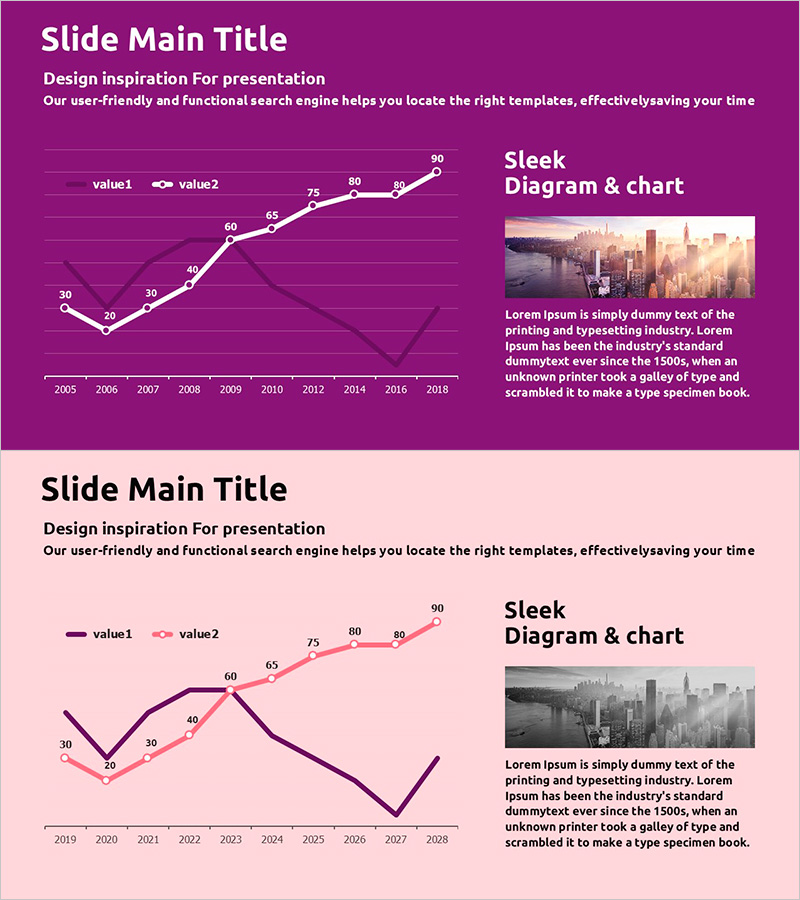
A dual-series line chart PowerPoint slide designed to visualize business progress and market analysis data. This presentation template features purple and pink color themes that clearly express data trends from 2005 to 2018. Each slide is created in 16:9 widescreen format with numeric labels and gridlines, optimized for competitive analysis and performance comparison. The slide deck is ready to use in reports and presentations, making it easy to communicate complex data intuitively to audiences.
Usage Points
-
Main Usage
Optimized for expressing two data series simultaneously over time, such as business progress, market analysis, and competitive benchmarking. Numeric labels and gridlines support accurate data reading, making it suitable for executive reports and investor presentations.
-
How to Use
Replace the data points and values on each slide with your actual data. The purple and pink color schemes can be adjusted from the color palette, and the year range and legend are fully editable. The 16:9 widescreen format is optimized for large-screen presentations.
-
Recommended For
Ideal for executives, marketing managers, business planners, and financial analysts creating quarterly or annual performance comparisons, market share trends, and competitive benchmarking materials. Particularly effective when comparing two metrics simultaneously.
-
Slide Structure
Two-slide deck with each slide featuring a dual-series line chart on a purple or pink background. The chart spans 2005–2018 on the X-axis with a 20–90 range on the Y-axis, with numeric labels at each data point. A title and description text area on the right allows for additional information input.
Related Products
-

Paint Splash Template Line Chart - Successful Business Strategy
#Business Strategy #Market and Competitor Analysis #Graph
-

Visualizing Project Progress and Future Prospects – Journey to Success
#Business Strategy #Market and Competitor Analysis #Graph
-

Market Status and Future Outlook – Data Illustrated in Blue and Yellow
#Market and Competitor Analysis #Graph #Market Status
-

Future Outlook and Expected Effects Visualization – Graph Representing Business Strategic Plans
#Business Strategy #Market and Competitor Analysis #Graph
