Purple Turquoise Line Chart – Market Analysis and Future Outlook
RJ0500023_12
- Last Update 06/13/2025
- File Size 0.8MB
- # of Slides 2
- File Format PPTX
- Slide Ratio 16:9
- Color
Keywords
About the Product
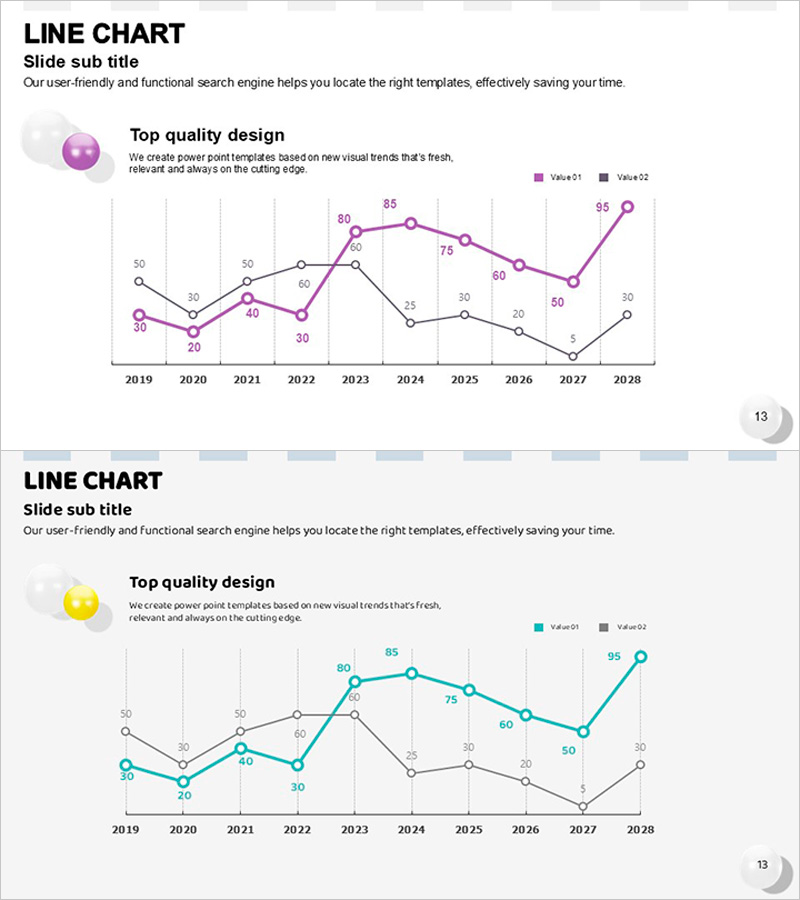
A 2-slide PowerPoint line chart set designed for market analysis and future outlook presentations. Each slide features a dual-series line chart with purple and turquoise data lines spanning a 10-year period (2019–2028). Data points are labeled with numeric values, and a legend clearly distinguishes the two series. The slides use a 16:9 widescreen format in PPTX, ready for immediate editing. Ideal for business reports, market analysis presentations, performance reviews, and strategic forecasting documents.
Usage Points
-
Main Usage
Visualize and compare two related data series over time to identify trends, patterns, and correlations. Commonly used for comparing market growth vs. competitor performance, revenue vs. expenses, actual vs. target metrics, or any paired metrics requiring simultaneous trend analysis.
-
How to Use
Open the slide and replace the sample data values with your actual figures. Edit the legend labels and colors to match your data series names. Customize the title and subtitle to reflect your presentation context. Insert into business reports, quarterly performance reviews, market analysis decks, or strategic planning presentations.
-
Recommended For
Marketing managers, financial analysts, executives, consultants, and researchers presenting market trends, financial performance, or competitive analysis. Suitable for quarterly earnings reports, market research presentations, investment proposals, business plans, and strategic forecasts.
-
Slide Structure
Each slide contains a title and subtitle area, a left-side icon element, and a right-side dual-series line chart. The chart includes an X-axis (10 years: 2019–2028), Y-axis (0–100 scale), two data series (purple and turquoise lines), labeled data points with numeric values, a legend on the right, and gridlines for easy value reading.
Related Products
-

Future Technology Industry Analysis Graph – Market Trends and Growth Prediction
#Market and Competitor Analysis #Diagram #Graph
-

Annual Growth Trends in Child Development
#Market and Competitor Analysis #Graph #Future Outlook
-

Line Graph and Key Messages – Market Outlook Analysis
#Market and Competitor Analysis #Graph #Future Outlook
-

Line Chart of Notepad Frame – Market and Competitor Analysis
#Market and Competitor Analysis #Graph #Future Outlook
