Presentation Template Featuring Donut Chart for Market Share – Business Introduction
RJ0200041_8
- Last Update 04/09/2025
- File Size 0.2MB
- # of Slides 2
- File Format PPTX
- Slide Ratio 16:9
- Color
Keywords
- #Content-Based Slides
- #Design-Based Slides
- #Business Introduction
- #Market and Competitor Analysis
- #Graph
- #Revenue Model
- #Market Share
- #Circles
- #Doughnut Chart
- #16:9
- #donut chart PowerPoint slide
- #pie chart presentation template
- #market share visualization
- #4-segment data chart
- #business performance slide
- #how to create donut chart in PowerPoint
About the Product
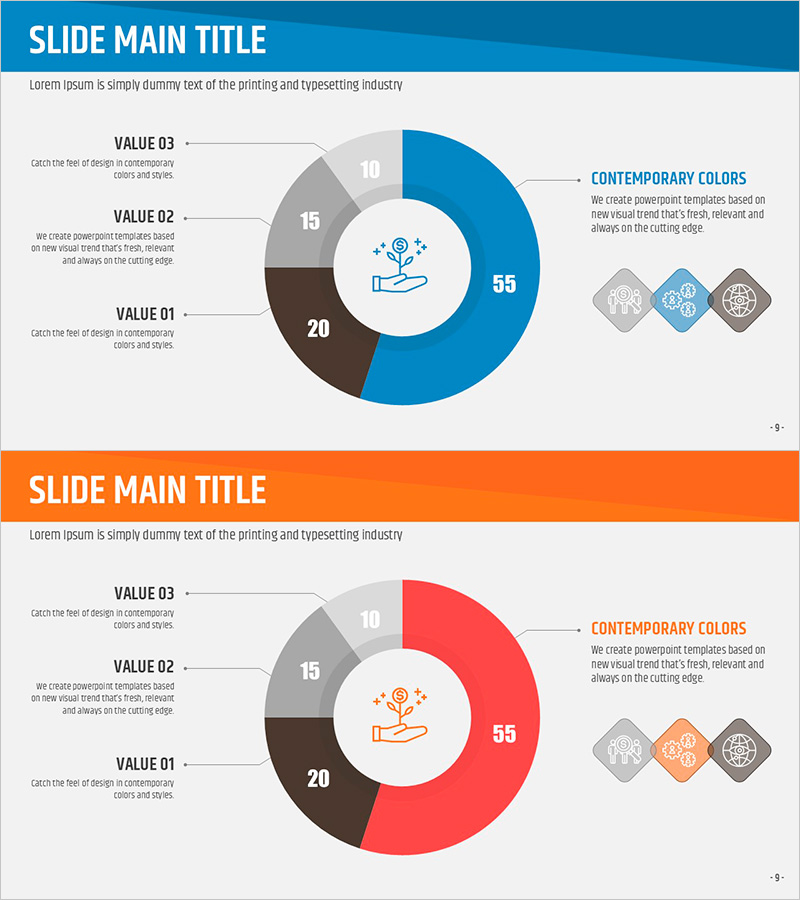
A professional donut chart PowerPoint slide designed to visualize market share and business performance with clarity and impact. This 2-slide presentation template features a blue and red dual-tone color scheme with gray and white accents, combining a central donut chart with left-aligned value labels (VALUE 01–03), numeric emphasis in the center, and right-side icon descriptions for layered information delivery. Available in 16:9 widescreen PPTX format, fully editable and ready for business introductions, marketing reports, quarterly performance presentations, and strategic overviews.
Usage Points
-
Main Usage
Effectively communicates proportional data such as market share, revenue distribution, customer composition, and segment breakdown. The centered numeric values (55, 20, 15, 10) draw immediate attention to key metrics, while left-side labels and right-side icons provide supporting context and meaning for each segment.
-
How to Use
Ideal for business introductions, quarterly and annual performance reports, marketing analysis presentations, customer segmentation studies, and data-driven decision-making discussions. Simply replace label text and numeric values with your actual data, and adjust colors to match your corporate brand identity.
-
Recommended For
Executive presentations, C-suite business briefings, marketing team market analysis, sales team customer composition explanations, finance team revenue structure analysis, and consulting firm client proposals.
-
Slide Structure
2-slide set. Each slide features a 4-segment donut chart with centered icon, left-aligned label area (3 value items), and right-aligned description area (title, descriptive text, and 3 supporting icons). Unified layout with colored header bar (blue/orange) and page numbering at bottom.
Related Products
-

Travel Agency Market Share and Trends – Data Slide for Competitive Advantage
#Market and Competitor Analysis #Diagram #Graph
-

Customer Share Analysis Chart – Insights for Successful Business
#Market and Competitor Analysis #Graph #Other
-

Donut Charts by Race Item – Market Share Analysis
#Market and Competitor Analysis #Graph #Market Share
-

Camping Tools Infographic Donut Chart – Market Share Analysis
#Market and Competitor Analysis #Graph #Market Status
