Causes of Fire Donut Chart – Visualizing Market Analysis
RJ0600044_7
- Last Update 07/02/2025
- File Size 6.9MB
- # of Slides 2
- File Format PPTX
- Slide Ratio 16:9
- Color
Keywords
About the Product
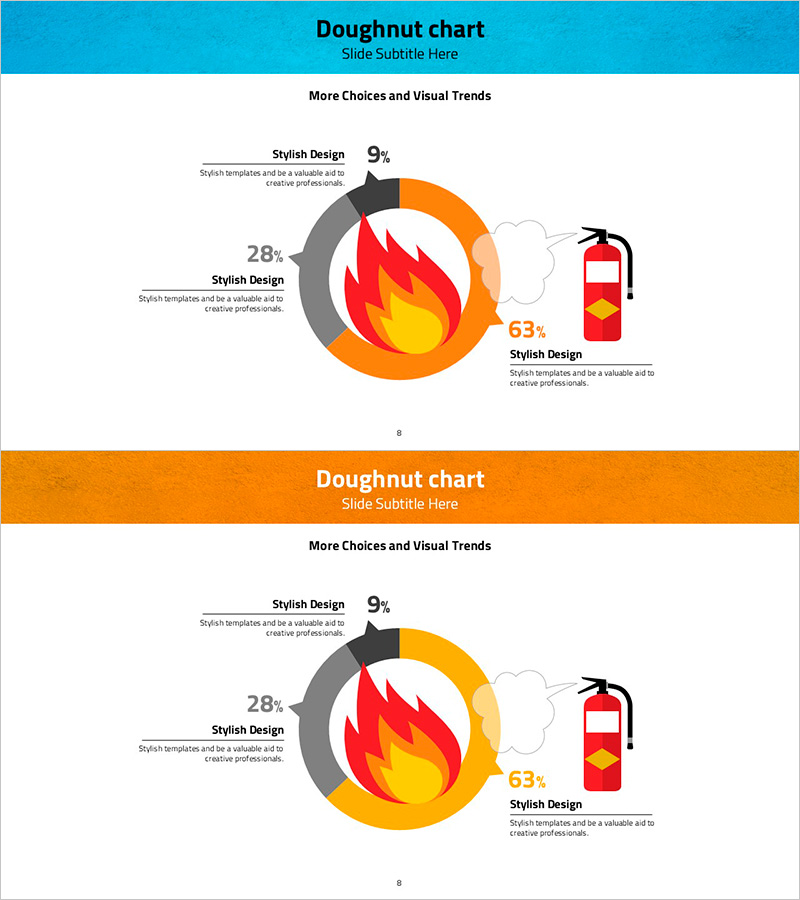
A PowerPoint donut chart slide visualizing fire causes divided into three segments with orange, gray, and red gradient colors. The circular graph clearly displays proportional data (9%, 28%, 63%) with a fire icon at the center and a fire extinguisher illustration on the right side. Each segment includes descriptive text areas for detailed information. The 2-slide set features a turquoise header on the first slide and an orange header on the second, optimized for 16:9 widescreen presentations. Ideal for business reports, market analysis presentations, and risk management documents where proportional data visualization is essential.
Usage Points
-
Main Usage
Visualize proportional data across three or more segments using a donut chart format. Effectively communicate market share, sales distribution, risk factors, customer composition, and cause analysis. The donut design emphasizes the relationship between parts and the whole while maintaining visual clarity.
-
How to Use
Insert into report analysis sections, market overview pages in marketing presentations, or performance analysis slides in executive meetings. Edit segment percentages and labels with your own data for immediate presentation use. The template structure allows quick customization without redesigning the chart.
-
Recommended For
Financial analysts, marketing professionals, business executives, management consultants, and data visualization specialists. Particularly effective for risk management, market analysis, sales performance reporting, customer segmentation, and comparative analysis presentations.
-
Slide Structure
2-slide set with turquoise header on slide 1 and orange header on slide 2. Each slide features a 3-segment donut chart with a fire icon in the center and fire extinguisher illustration on the right. Percentage values (9%, 28%, 63%) and editable text areas are positioned around each segment for customization.
Related Products
-

Equipment Demand Configuration Graph – Effective Visualization for Market Analysis
#Market and Competitor Analysis #Diagram #Graph
-

Analysis of Crime Occurrence Locations – Data Visualization
#Market and Competitor Analysis #Graph #Market Share
-

World Map and Share Chart for Market Analysis – Effective Data Visualization
#Market and Competitor Analysis #Graph #Other
-

Donut Chart Slide for Furniture Preferences Survey
#Market and Competitor Analysis #Graph #Market Share
