Donut Charts by Race Item – Market Share Analysis
RJ0600037_12
- Last Update 06/30/2025
- File Size 0.7MB
- # of Slides 2
- File Format PPTX
- Slide Ratio 16:9
- Color
Keywords
- #Content-Based Slides
- #Design-Based Slides
- #Market and Competitor Analysis
- #Graph
- #Market Share
- #Market Overview
- #Circles
- #Doughnut Chart
- #16:9
- #donut chart PowerPoint
- #pie chart slide template
- #market share analysis PPT
- #ratio visualization slide
- #donut graph presentation
- #PowerPoint chart template download
About the Product
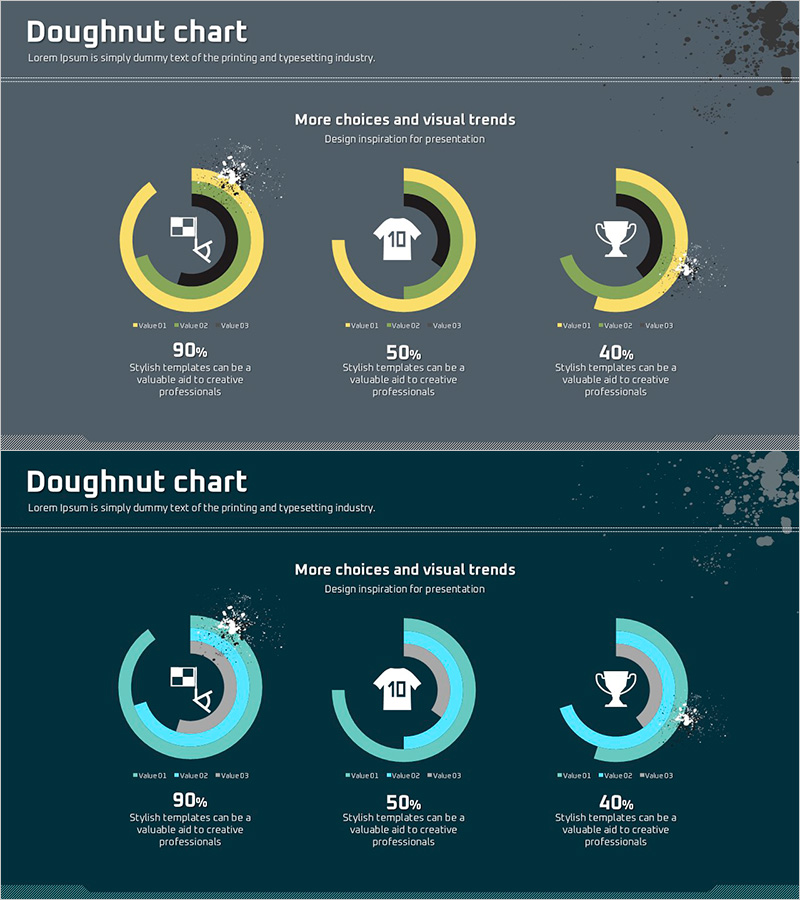
A donut chart PowerPoint slide template designed to visualize market share, item-by-item ratios, and sales composition. Two design versions are provided with yellow-green and cyan-pink gradient color schemes, each displaying three data segments with clear proportional representation. Central icons (healthcare, real estate, trophy) combined with numerical data enable immediate use in presentations. The 16:9 widescreen format with 2-slide layout is fully editable for various market analysis scenarios.
Usage Points
-
Main Usage
Optimized for expressing the relative proportions of three data items—such as market share, sales composition, or item-by-item ratios—in circular format. The center area of the donut allows for highlighting key messages or critical figures, making it ideal for business presentations, marketing analysis, and financial reports.
-
How to Use
Replace the segment colors and numerical values in each donut chart with your own data. The center icon can be swapped to match your presentation topic, and legend and percentage labels are fully editable. Choose between the two color versions based on your presentation's visual tone.
-
Recommended For
Marketing managers, financial analysts, business planners, and sales directors presenting market analysis, sales performance, customer composition, or budget allocation. Suitable for quarterly performance reports, investor presentations, executive briefings, and strategic planning meetings.
-
Slide Structure
2-slide layout. Each slide contains one donut chart divided into 3 segments. First slide features yellow-green gradient; second slide uses cyan-pink tones. Each segment displays percentage values, center icon (healthcare, real estate, trophy), and legend positioned at the bottom.
Related Products
-

Doughnut Chart for Product and Service Share Analysis
#Market and Competitor Analysis #Graph #Market Share
-

Green Orange Market Share Visualization – Data-Driven Insights
#Market and Competitor Analysis #Graph #Other
-

Geometry PPT Template Wide Map & Doughnut Chart
#Market and Competitor Analysis #Graph #Other
-

Doughnut Chart for Office Worker Commuting Survey Results – Market Trends Visualization
#Market and Competitor Analysis #Graph #Market Status
