Camping Tools Infographic Donut Chart – Market Share Analysis
RJ0600031_10
- Last Update 06/29/2025
- File Size 1.5MB
- # of Slides 2
- File Format PPTX
- Slide Ratio 16:9
- Color
Keywords
About the Product
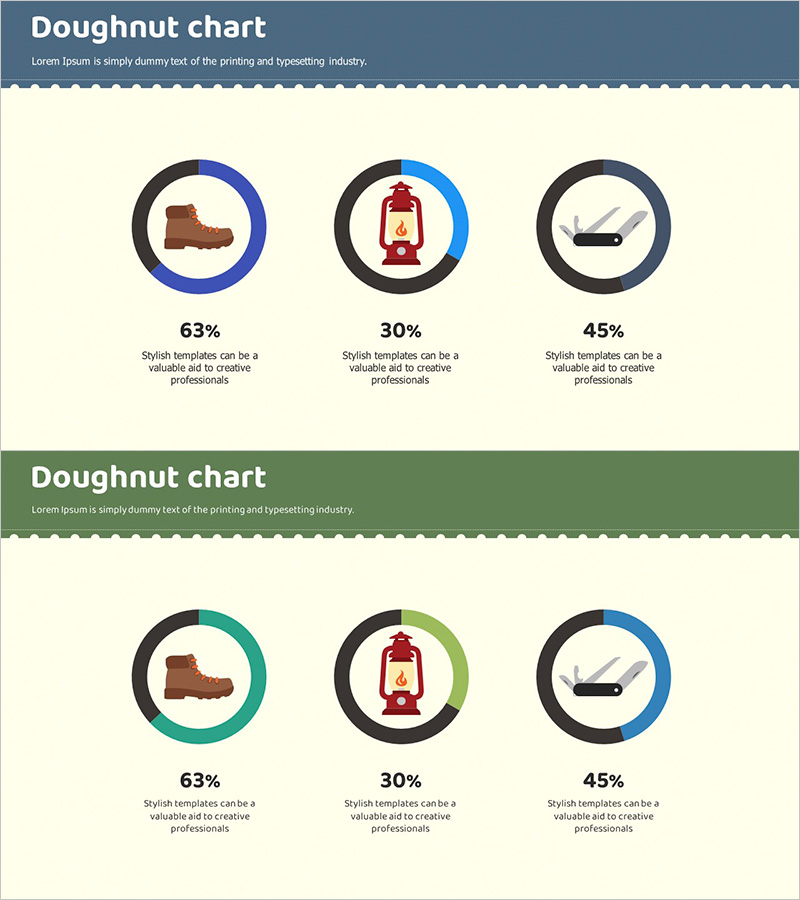
A 3-item donut chart PowerPoint slide designed for camping equipment market analysis. This infographic visualization displays market share percentages (63%, 30%, 45%) for boots, lantern, and pan with corresponding icons. The design features black outer rings with blue, teal, and gray donut segments on a cream background, enabling clear data representation. The 2-slide PPTX template in 16:9 aspect ratio is fully editable for marketing analysis, business reports, and product comparison presentations.
Usage Points
-
Main Usage
Visualizes market share, sales ratios, and customer distribution across three product categories or segments. The donut chart's central space accommodates icons that intuitively communicate each item's meaning and data relationship.
-
How to Use
Apply this template in marketing strategy presentations, business reports, and product analysis documents to compare competitors, present market conditions, or segment customer demographics. Customize the donut ring colors and percentages with your data, and replace icons with relevant product images to create a tailored chart.
-
Recommended For
Marketing managers, business analysts, and sales teams presenting market analysis findings to executives or clients. Ideal for consumer goods, retail, tourism, and sports equipment industries when positioning products, reporting to management, or pitching to investors.
-
Slide Structure
Two-slide layout: first slide features blue and black donut rings with three segments; second slide displays teal, black, and gray donut rings. Each donut centers an icon (boot, lantern, pan), with percentage values and descriptive text aligned below for clarity.
Related Products
-

Pie Chart for Decimal Ratio Analysis – Market Share Status
#Market and Competitor Analysis #Graph #Market Status
-

Modern Blue Presentation Doughnut Chart – Market Share Analysis
#Market and Competitor Analysis #Graph #Market Status
-

Office Desk Donut Chart Analysis – Visualizing Market Share
#Market and Competitor Analysis #Graph #Market Status
-

Distribution of Regulatory Components – Visualizing Market Conditions
#Market and Competitor Analysis #Graph #Market Status
