Origami Presentation Template Vertical Bar Chart – Visualize Your Business Performance
RJ0200041_7
- Last Update 04/09/2025
- File Size 0.2MB
- # of Slides 2
- File Format PPTX
- Slide Ratio 16:9
- Color
Keywords
- #Content-Based Slides
- #Design-Based Slides
- #Business Introduction
- #Financial Plans and Performance
- #Graph
- #Technological Status
- #Sales and Revenue
- #Column
- #Grouped Column
- #16:9
- #vertical bar chart PowerPoint
- #grouped bar graph presentation
- #data comparison slide
- #business performance chart
- #financial analysis PPT
About the Product
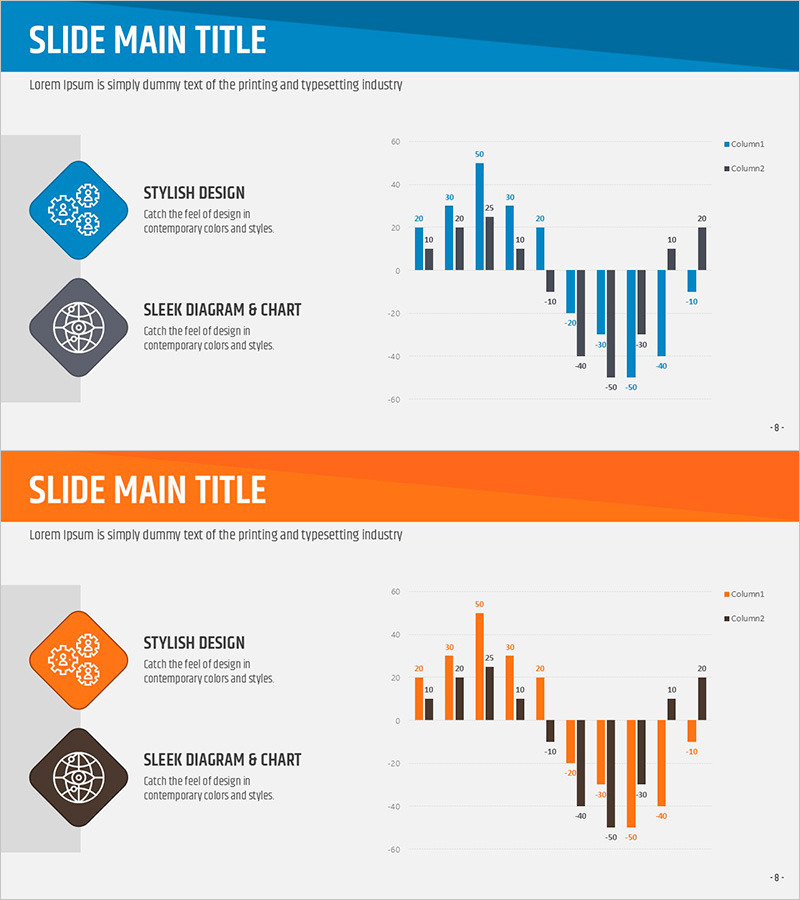
A 2-slide vertical bar chart PowerPoint template designed to visualize business performance and financial metrics with clarity. The slides feature grouped bar charts with blue and black data series positioned side-by-side, enabling intuitive comparison of values across categories. Supporting both positive and negative values, this chart structure is ideal for analyzing sales figures, profit margins, growth rates, and other key business indicators. Formatted in PPTX with 16:9 widescreen ratio, the vector-based charts are fully editable and ready for immediate customization to match your specific data requirements.
Usage Points
-
Main Usage
Compare quantitative data across two categories—such as business performance, financial results, quarterly revenue, or departmental achievements. Bar height intuitively represents numerical magnitude, allowing audiences to instantly grasp data differences and trends.
-
How to Use
Deploy in business reports, investor presentations, quarterly earnings announcements, and marketing performance reviews where quantitative data comparison is essential. Easily customize legend labels, axis titles, and data values to align with your specific metrics and presentation context.
-
Recommended For
Finance teams, sales departments, marketing professionals, and executives presenting performance reports benefit from this template. Ideal for year-over-year comparisons, target-versus-actual analysis, and situations requiring clear visualization of dual-metric performance.
-
Slide Structure
Two-slide set featuring grouped vertical bar charts. Slide 1 uses blue-series color scheme with 2 data series; Slide 2 uses orange-series color scheme with 2 data series. Each slide accommodates 8–10 categorical items with support for both positive and negative values in a grouped arrangement.
Related Products
-

Carbon Neutral Sales and Profit Chart – Sustainable Management
#Market and Competitor Analysis #Financial Plans and Performance #Graph
-

Sea Lighthouse Future Competitor Market Forecast Vertical Bar Graph
#Business Strategy #Financial Plans and Performance #Diagram
-

Revenue Vertical Bar Chart – Innovation in Market Analysis
#Market and Competitor Analysis #Financial Plans and Performance #Graph
-

Orange Green Profit and Loss Chart – Visualizing Revenue and Profit
#Financial Plans and Performance #Diagram #Graph
